| Red | Green | Blue | |
| z | 17.64 | ||
| znorm | Inf | ||
| sky | -Inf | -Inf | -Inf |
| S/N | 20.4 | 38.2 | 42.1 |
| S/N(c) | 0.0 | 0.0 | 0.0 |
| SN(E/C) |
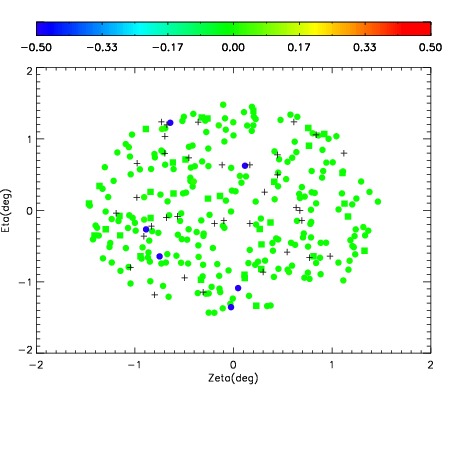
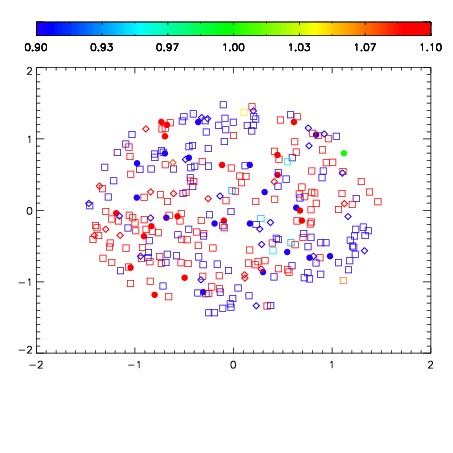
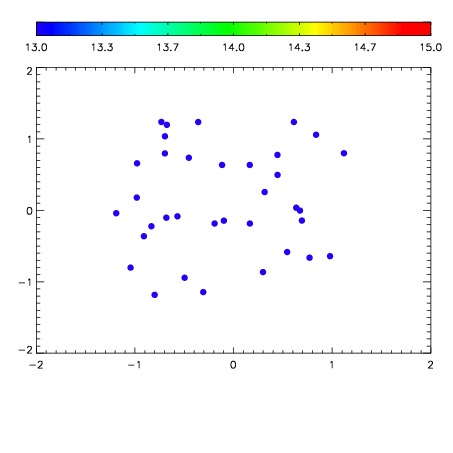

| Frame | Nreads | Zeropoints | Mag plots | Spatial mag deviation | Spatial sky 16325A emission deviations (filled: sky, open: star) | Spatial sky continuum emission | Spatial sky telluric CO2 absorption deviations (filled: H < 10) | |||||||||||||||||||||||
| 0 | 0 |
|
|
|
|
|
|
| IPAIR | NAME | SHIFT | NEWSHIFT | S/N | NAME | SHIFT | NEWSHIFT | S/N |
| 0 | 07520067 | 0.470364 | 0.00000 | 173.614 | 07520065 | 0.00000 | 0.470364 | 167.588 |
| 1 | 07520071 | 0.469947 | 0.000416994 | 189.531 | 07520072 | 0.00405948 | 0.466305 | 182.898 |
| 2 | 07520070 | 0.469436 | 0.000928015 | 185.005 | 07520069 | 0.000488653 | 0.469875 | 181.111 |
| 3 | 07520066 | 0.470353 | 1.09971e-05 | 173.783 | 07520068 | 0.00324025 | 0.467124 | 178.014 |