| Red | Green | Blue | |
| z | 17.64 | ||
| znorm | Inf | ||
| sky | -Inf | -Inf | -Inf |
| S/N | 18.5 | 34.1 | 37.0 |
| S/N(c) | 0.0 | 0.0 | 0.0 |
| SN(E/C) |
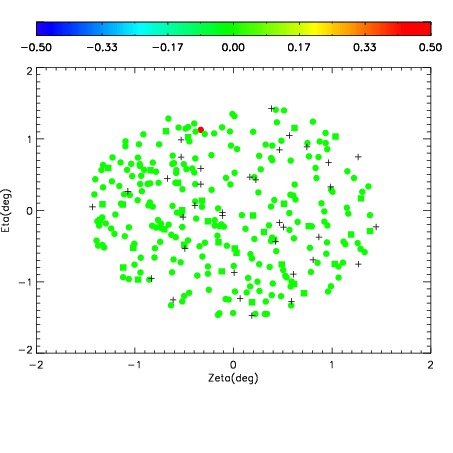
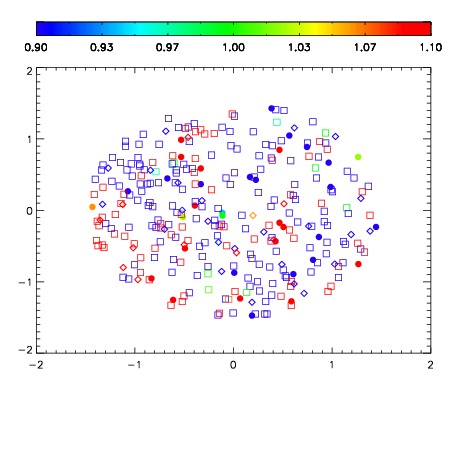
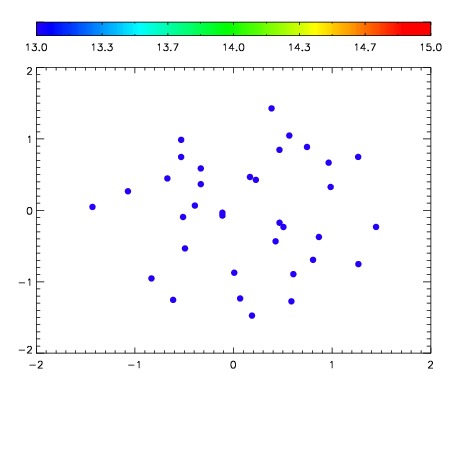

| Frame | Nreads | Zeropoints | Mag plots | Spatial mag deviation | Spatial sky 16325A emission deviations (filled: sky, open: star) | Spatial sky continuum emission | Spatial sky telluric CO2 absorption deviations (filled: H < 10) | |||||||||||||||||||||||
| 0 | 0 |
|
|
|
|
|
|
| IPAIR | NAME | SHIFT | NEWSHIFT | S/N | NAME | SHIFT | NEWSHIFT | S/N |
| 0 | 07210072 | 0.489598 | 0.00000 | 130.207 | 07210073 | 0.0108049 | 0.478793 | 125.177 |
| 1 | 07210076 | 0.485925 | 0.00367302 | 179.159 | 07210074 | 0.00852481 | 0.481073 | 157.367 |
| 2 | 07210075 | 0.485570 | 0.00402799 | 173.780 | 07210077 | 0.00930512 | 0.480293 | 150.950 |
| 3 | 07210071 | 0.489234 | 0.000364006 | 106.767 | 07210070 | 0.00000 | 0.489598 | 100.754 |