| Red | Green | Blue | |
| z | 17.64 | ||
| znorm | Inf | ||
| sky | -Inf | -Inf | -Inf |
| S/N | 18.8 | 36.2 | 37.4 |
| S/N(c) | 0.0 | 0.0 | 0.0 |
| SN(E/C) |
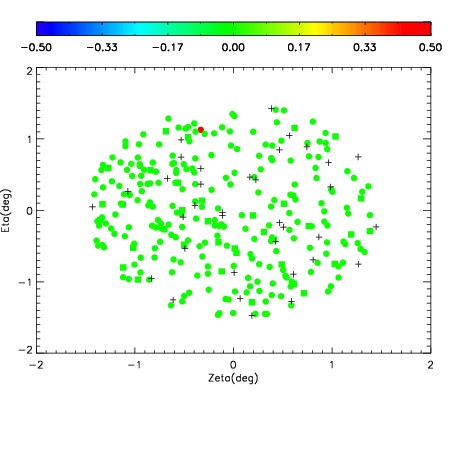
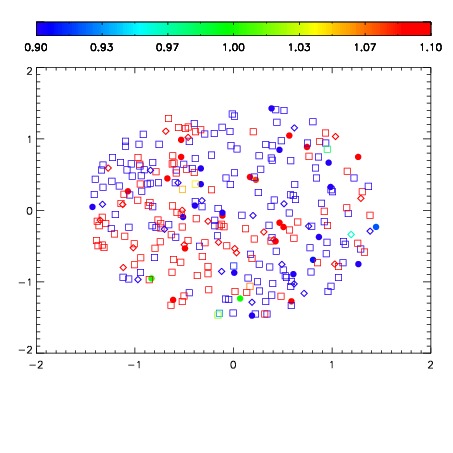
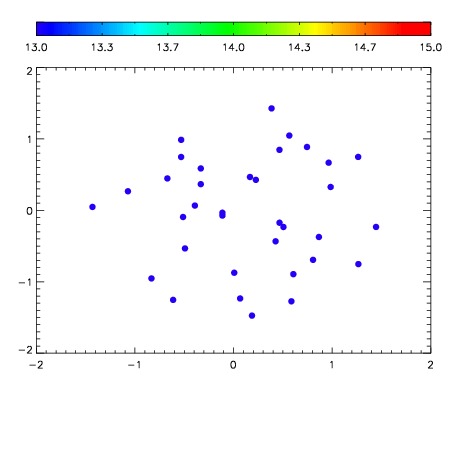

| Frame | Nreads | Zeropoints | Mag plots | Spatial mag deviation | Spatial sky 16325A emission deviations (filled: sky, open: star) | Spatial sky continuum emission | Spatial sky telluric CO2 absorption deviations (filled: H < 10) | |||||||||||||||||||||||
| 0 | 0 |
|
|
|
|
|
|
| IPAIR | NAME | SHIFT | NEWSHIFT | S/N | NAME | SHIFT | NEWSHIFT | S/N |
| 0 | 07280087 | 0.490187 | 0.00000 | 181.015 | 07280088 | 0.00392907 | 0.486258 | 182.383 |
| 1 | 07280090 | 0.488285 | 0.00190198 | 198.944 | 07280089 | 0.00191890 | 0.488268 | 192.877 |
| 2 | 07280086 | 0.489158 | 0.00102898 | 159.680 | 07280081 | 0.00000 | 0.490187 | 169.244 |
| 3 | 07280083 | 0.489655 | 0.000532001 | 148.137 | 07280084 | 0.00494653 | 0.485240 | 154.901 |
| 4 | 07280082 | 0.488638 | 0.00154898 | 143.951 | 07280085 | 0.00245207 | 0.487735 | 154.740 |