| Red | Green | Blue | |
| z | 17.64 | ||
| znorm | Inf | ||
| sky | -Inf | -Inf | -Inf |
| S/N | 5.5 | 10.6 | 12.0 |
| S/N(c) | 0.0 | 0.0 | 0.0 |
| SN(E/C) |
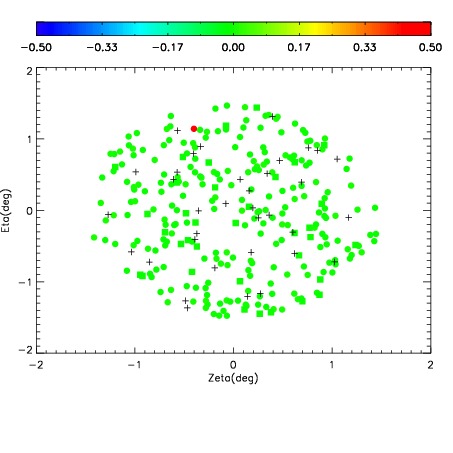
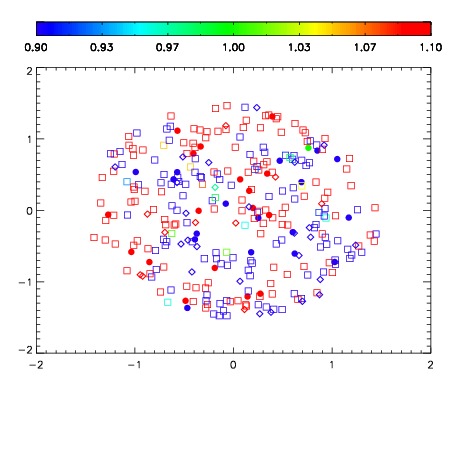
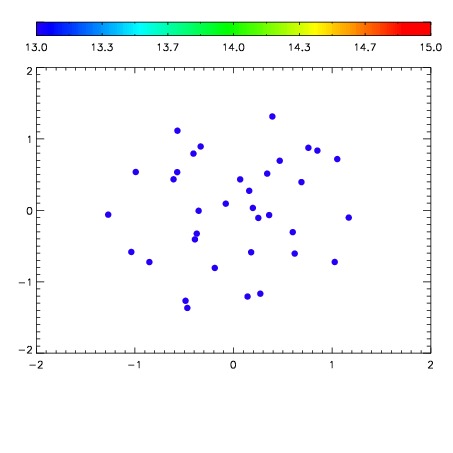

| Frame | Nreads | Zeropoints | Mag plots | Spatial mag deviation | Spatial sky 16325A emission deviations (filled: sky, open: star) | Spatial sky continuum emission | Spatial sky telluric CO2 absorption deviations (filled: H < 10) | |||||||||||||||||||||||
| 0 | 0 |
|
|
|
|
|
|
| IPAIR | NAME | SHIFT | NEWSHIFT | S/N | NAME | SHIFT | NEWSHIFT | S/N |
| 0 | 07290043 | 0.483631 | 0.00000 | 89.9990 | 07290040 | 0.00203136 | 0.481600 | 82.2269 |
| 1 | 07290042 | 0.483596 | 3.50177e-05 | 104.867 | 07290044 | 0.00131542 | 0.482316 | 82.4899 |
| 2 | 07290039 | 0.482573 | 0.00105801 | 89.0342 | 07290041 | 0.00181978 | 0.481811 | 81.8145 |
| 3 | 07290038 | 0.481521 | 0.00211000 | 74.2437 | 07290037 | 0.00000 | 0.483631 | 79.5066 |