| Red | Green | Blue | |
| z | 17.64 | ||
| znorm | Inf | ||
| sky | -NaN | -Inf | -Inf |
| S/N | 25.9 | 41.9 | 48.0 |
| S/N(c) | 0.0 | 0.0 | 0.0 |
| SN(E/C) |
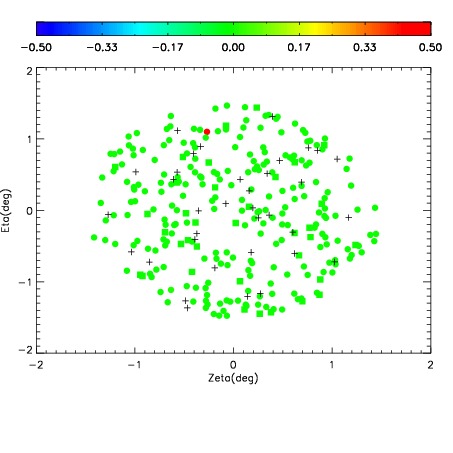
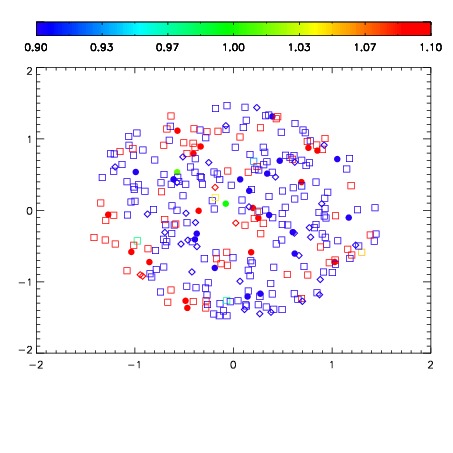


| Frame | Nreads | Zeropoints | Mag plots | Spatial mag deviation | Spatial sky 16325A emission deviations (filled: sky, open: star) | Spatial sky continuum emission | Spatial sky telluric CO2 absorption deviations (filled: H < 10) | |||||||||||||||||||||||
| 0 | 0 |
|
|
|
|
|
|
| IPAIR | NAME | SHIFT | NEWSHIFT | S/N | NAME | SHIFT | NEWSHIFT | S/N |
| 0 | 09970094 | 0.518298 | 0.00000 | 212.398 | 09970095 | 0.000223053 | 0.518075 | 210.236 |
| 1 | 09970093 | 0.517959 | 0.000338972 | 207.653 | 09970092 | 0.000746435 | 0.517552 | 187.692 |
| 2 | 09970090 | 0.518251 | 4.69685e-05 | 184.473 | 09970091 | 0.00119685 | 0.517101 | 185.382 |
| 3 | 09970089 | 0.517359 | 0.000938952 | 183.554 | 09970088 | 0.00000 | 0.518298 | 180.139 |