| Red | Green | Blue | |
| z | 17.64 | ||
| znorm | Inf | ||
| sky | -Inf | -Inf | -Inf |
| S/N | 32.6 | 53.8 | 60.3 |
| S/N(c) | 0.0 | 0.0 | 0.0 |
| SN(E/C) |

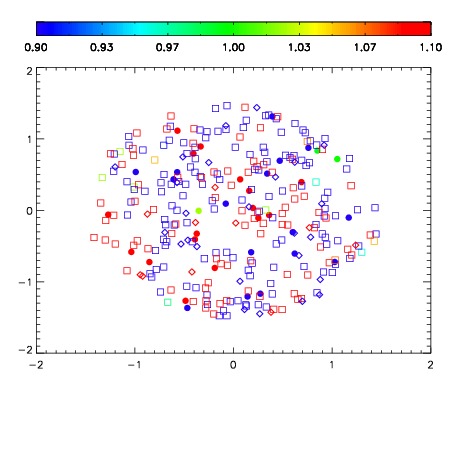
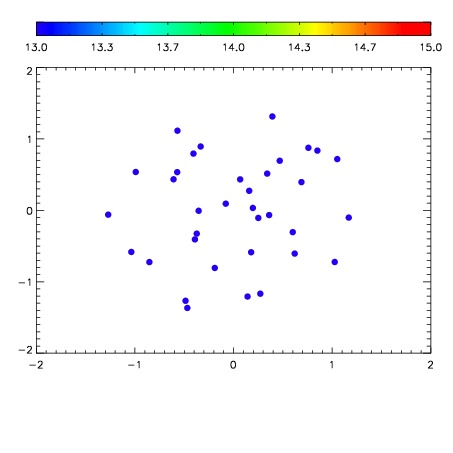

| Frame | Nreads | Zeropoints | Mag plots | Spatial mag deviation | Spatial sky 16325A emission deviations (filled: sky, open: star) | Spatial sky continuum emission | Spatial sky telluric CO2 absorption deviations (filled: H < 10) | |||||||||||||||||||||||
| 0 | 0 |
|
|
|
|
|
|
| IPAIR | NAME | SHIFT | NEWSHIFT | S/N | NAME | SHIFT | NEWSHIFT | S/N |
| 0 | 10200083 | 0.496801 | 0.00000 | 210.408 | 10200085 | 0.00337311 | 0.493428 | 203.783 |
| 1 | 10200090 | 0.496295 | 0.000505984 | 219.800 | 10200089 | 0.000786924 | 0.496014 | 221.682 |
| 2 | 10200082 | 0.495388 | 0.00141299 | 219.148 | 10200088 | 0.00143313 | 0.495368 | 221.365 |
| 3 | 10200087 | 0.494975 | 0.00182599 | 217.114 | 10200081 | 0.00000 | 0.496801 | 214.652 |
| 4 | 10200086 | 0.494747 | 0.00205398 | 211.489 | 10200084 | 0.00348478 | 0.493316 | 207.118 |