| Red | Green | Blue | |
| z | 17.64 | ||
| znorm | Inf | ||
| sky | -Inf | -Inf | -Inf |
| S/N | 30.7 | 51.8 | 55.7 |
| S/N(c) | 0.0 | 0.0 | 0.0 |
| SN(E/C) |

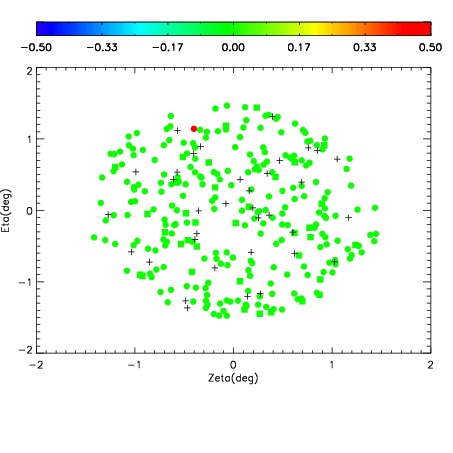
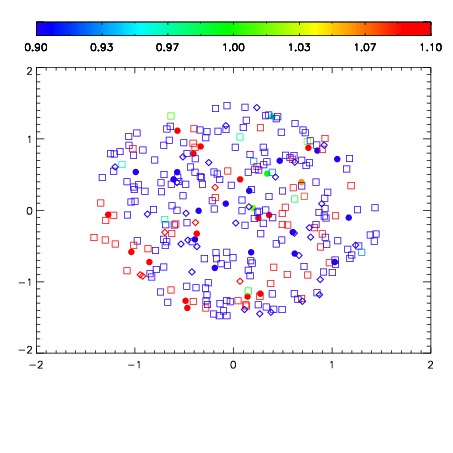
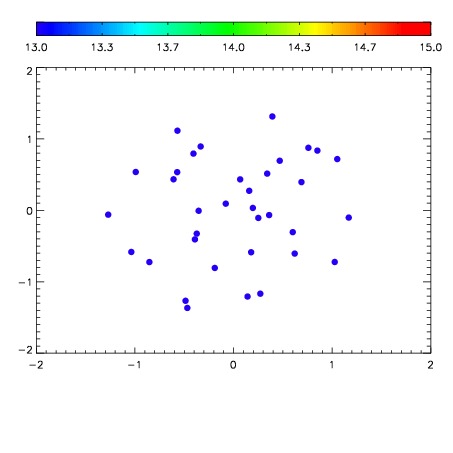

| Frame | Nreads | Zeropoints | Mag plots | Spatial mag deviation | Spatial sky 16325A emission deviations (filled: sky, open: star) | Spatial sky continuum emission | Spatial sky telluric CO2 absorption deviations (filled: H < 10) | |||||||||||||||||||||||
| 0 | 0 |
|
|
|
|
|
|
| IPAIR | NAME | SHIFT | NEWSHIFT | S/N | NAME | SHIFT | NEWSHIFT | S/N |
| 0 | 10240083 | 0.496052 | 0.00000 | 221.795 | 10240085 | 0.00355244 | 0.492500 | 224.032 |
| 1 | 10240087 | 0.495435 | 0.000616997 | 222.707 | 10240088 | 0.00437107 | 0.491681 | 229.635 |
| 2 | 10240082 | 0.495586 | 0.000465989 | 218.229 | 10240084 | 0.00335881 | 0.492693 | 220.757 |
| 3 | 10240086 | 0.495976 | 7.59959e-05 | 215.133 | 10240081 | 0.00000 | 0.496052 | 212.315 |