| Red | Green | Blue | |
| z | 17.64 | ||
| znorm | Inf | ||
| sky | -Inf | -Inf | -Inf |
| S/N | 23.3 | 40.0 | 46.4 |
| S/N(c) | 0.0 | 0.0 | 0.0 |
| SN(E/C) |
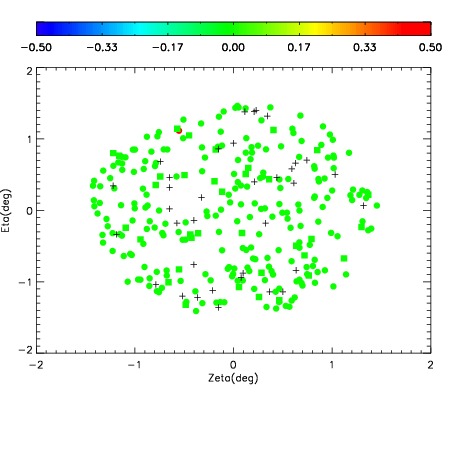
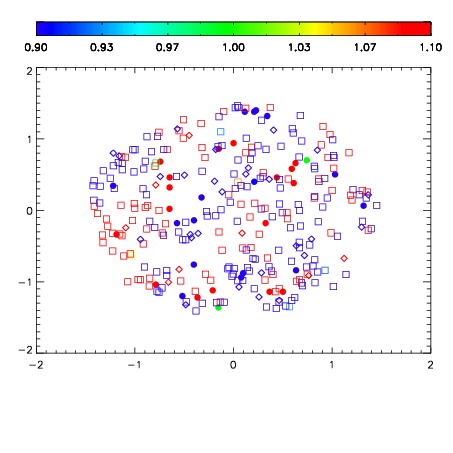
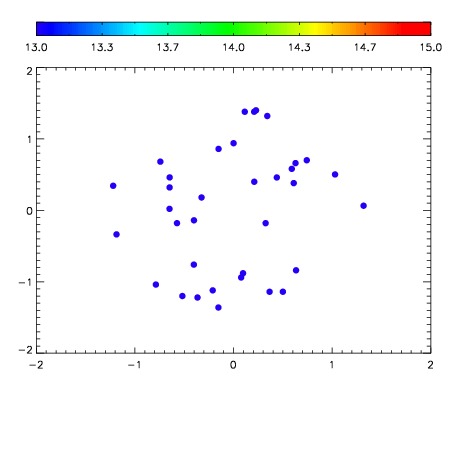

| Frame | Nreads | Zeropoints | Mag plots | Spatial mag deviation | Spatial sky 16325A emission deviations (filled: sky, open: star) | Spatial sky continuum emission | Spatial sky telluric CO2 absorption deviations (filled: H < 10) | |||||||||||||||||||||||
| 0 | 0 |
|
|
|
|
|
|
| IPAIR | NAME | SHIFT | NEWSHIFT | S/N | NAME | SHIFT | NEWSHIFT | S/N |
| 0 | 07230053 | 0.471927 | 0.00000 | 236.510 | 07230048 | 0.00000 | 0.471927 | 229.765 |
| 1 | 07230049 | 0.469173 | 0.00275397 | 236.000 | 07230051 | 0.00125486 | 0.470672 | 214.820 |
| 2 | 07230050 | 0.469744 | 0.00218299 | 221.307 | 07230052 | 0.00130522 | 0.470622 | 214.620 |
| 3 | 07230054 | 0.471725 | 0.000202000 | 213.974 | 07230055 | 0.00385629 | 0.468071 | 199.268 |