| Red | Green | Blue | |
| z | 17.64 | ||
| znorm | Inf | ||
| sky | -Inf | -NaN | -Inf |
| S/N | 22.2 | 40.3 | 43.2 |
| S/N(c) | 0.0 | 0.0 | 0.0 |
| SN(E/C) |
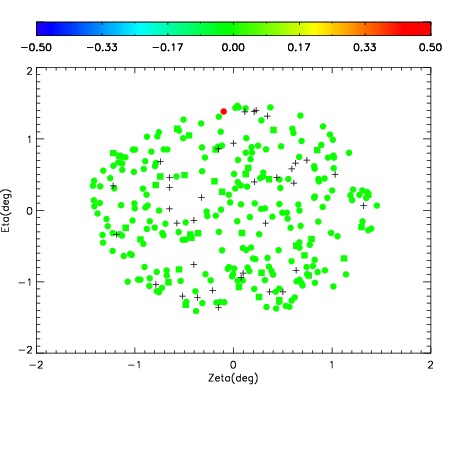
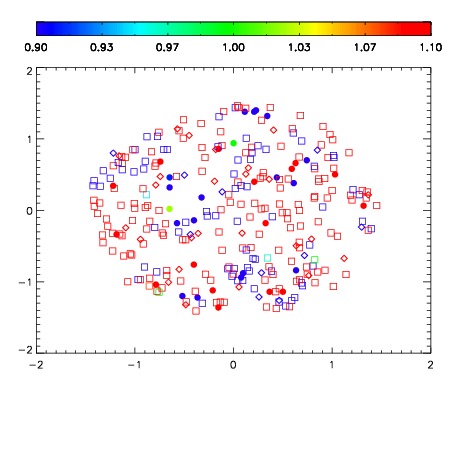
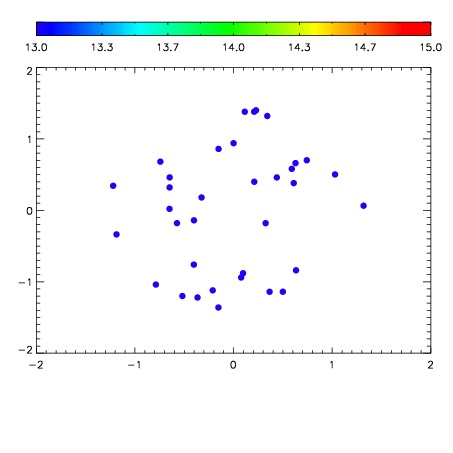

| Frame | Nreads | Zeropoints | Mag plots | Spatial mag deviation | Spatial sky 16325A emission deviations (filled: sky, open: star) | Spatial sky continuum emission | Spatial sky telluric CO2 absorption deviations (filled: H < 10) | |||||||||||||||||||||||
| 0 | 0 |
|
|
|
|
|
|
| IPAIR | NAME | SHIFT | NEWSHIFT | S/N | NAME | SHIFT | NEWSHIFT | S/N |
| 0 | 07520028 | 0.476473 | 0.00000 | 230.970 | 07520029 | -0.00213863 | 0.478612 | 228.125 |
| 1 | 07520032 | 0.476300 | 0.000173002 | 243.452 | 07520026 | 0.00000 | 0.476473 | 234.365 |
| 2 | 07520027 | 0.475943 | 0.000530005 | 236.677 | 07520033 | 0.000897896 | 0.475575 | 229.251 |
| 3 | 07520031 | 0.475853 | 0.000620008 | 220.355 | 07520030 | -0.00157994 | 0.478053 | 220.191 |