| Red | Green | Blue | |
| z | 17.64 | ||
| znorm | Inf | ||
| sky | -Inf | -Inf | -Inf |
| S/N | 10.3 | 20.7 | 24.2 |
| S/N(c) | 0.0 | 0.0 | 0.0 |
| SN(E/C) |
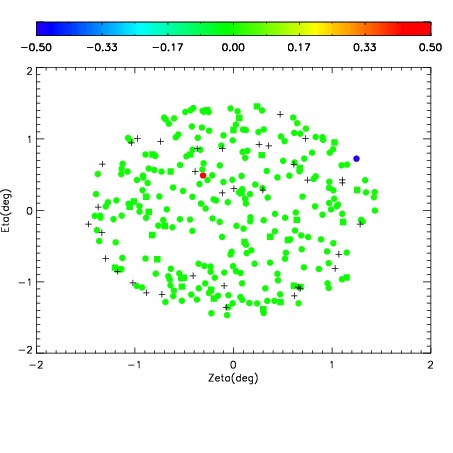
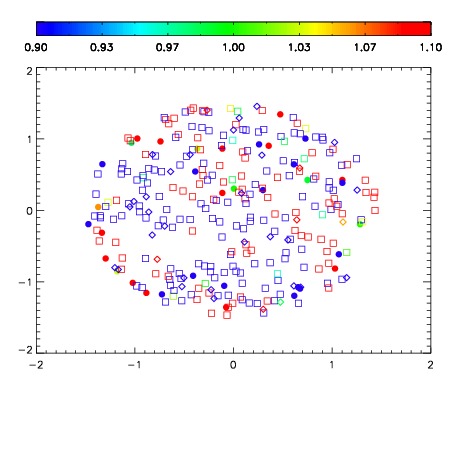
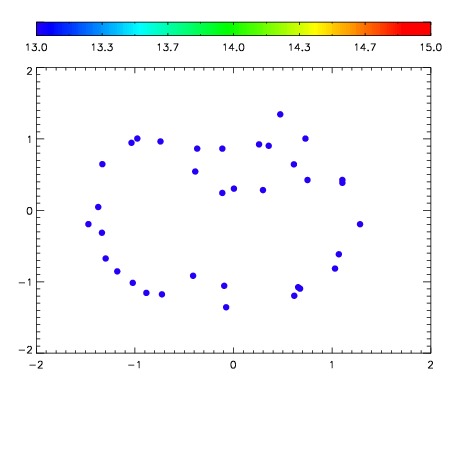

| Frame | Nreads | Zeropoints | Mag plots | Spatial mag deviation | Spatial sky 16325A emission deviations (filled: sky, open: star) | Spatial sky continuum emission | Spatial sky telluric CO2 absorption deviations (filled: H < 10) | |||||||||||||||||||||||
| 0 | 0 |
|
|
|
|
|
|
| IPAIR | NAME | SHIFT | NEWSHIFT | S/N | NAME | SHIFT | NEWSHIFT | S/N |
| 0 | 07220052 | 0.475179 | 0.00000 | 122.378 | 07220046 | 0.00000 | 0.475179 | 116.131 |
| 1 | 07220048 | 0.471551 | 0.00362799 | 142.793 | 07220053 | -0.00250516 | 0.477684 | 172.332 |
| 2 | 07220047 | 0.471754 | 0.00342497 | 128.521 | 07220050 | -0.000490061 | 0.475669 | 128.804 |
| 3 | 07220051 | 0.474198 | 0.000980973 | 107.121 | 07220049 | 0.00164291 | 0.473536 | 106.555 |