| Frame | Nreads | Zeropoints | Mag plots
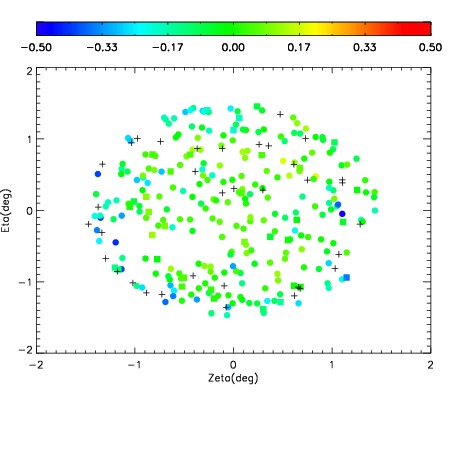
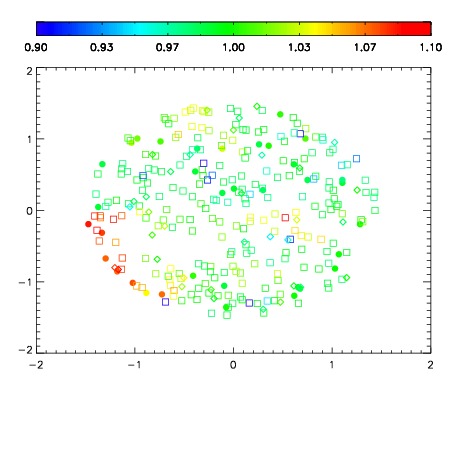
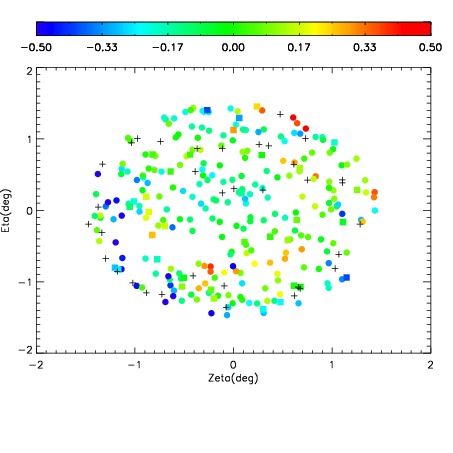
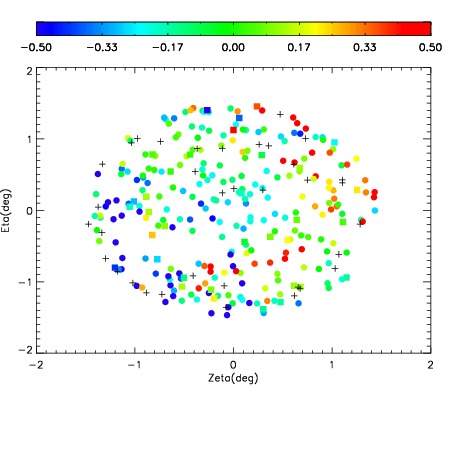
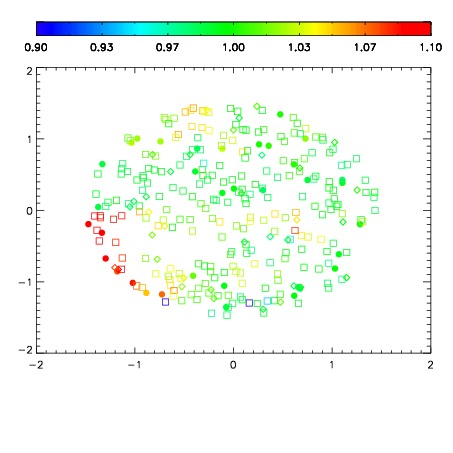
| Spatial mag deviation
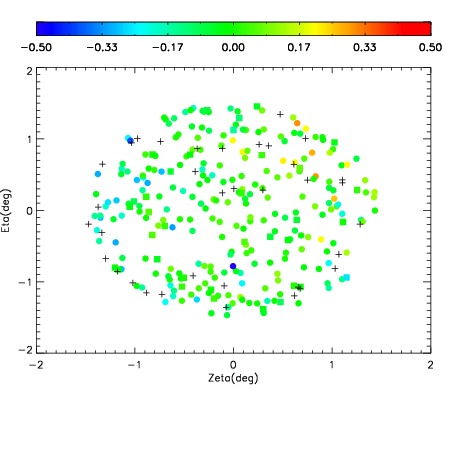
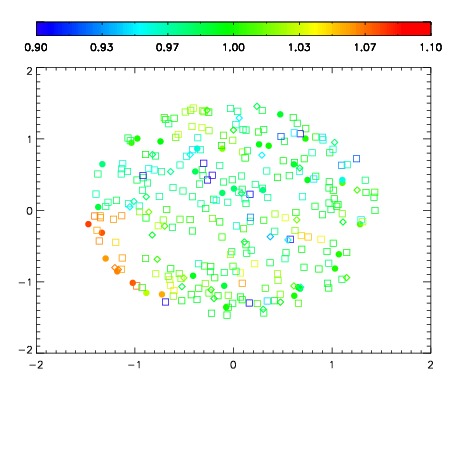
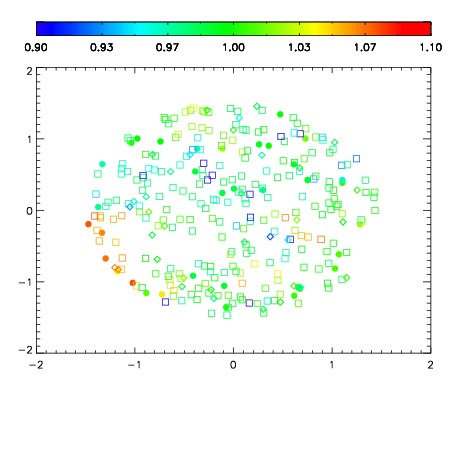
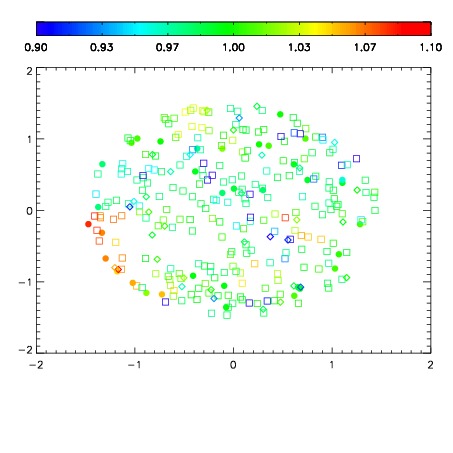
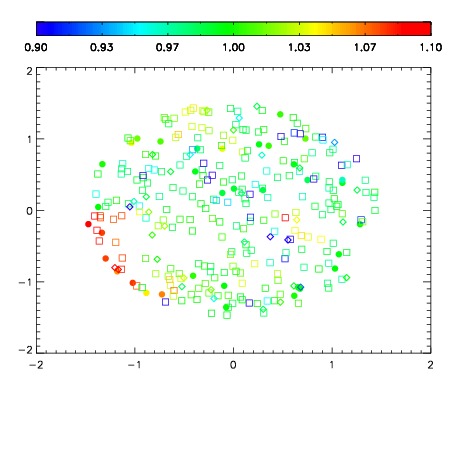
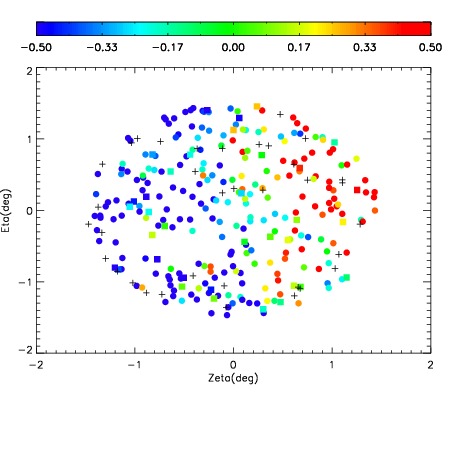
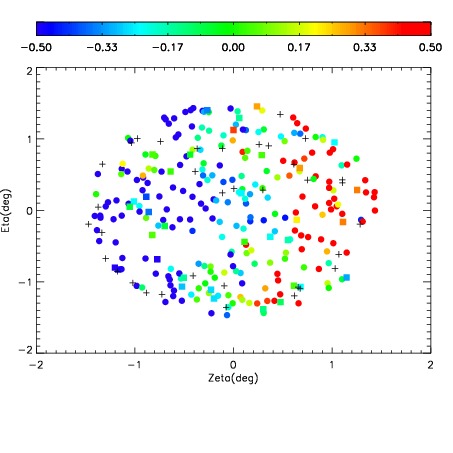
| Spatial sky 16325A emission deviations (filled: sky, open: star)
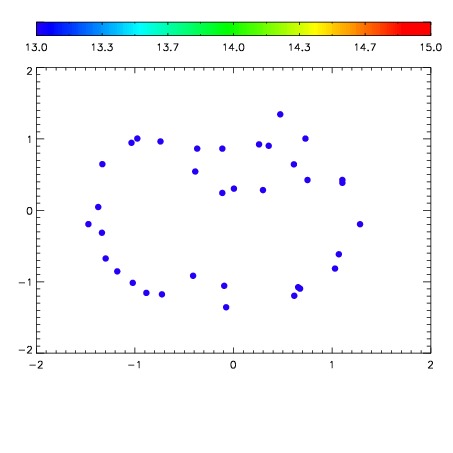
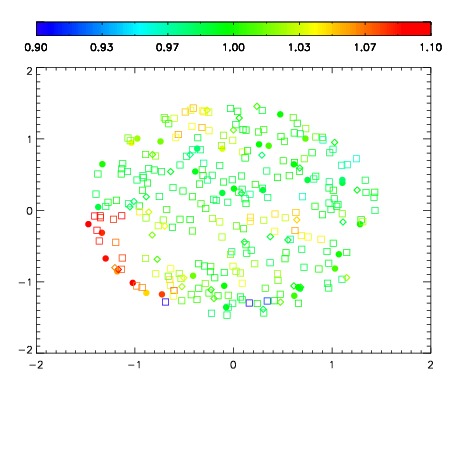
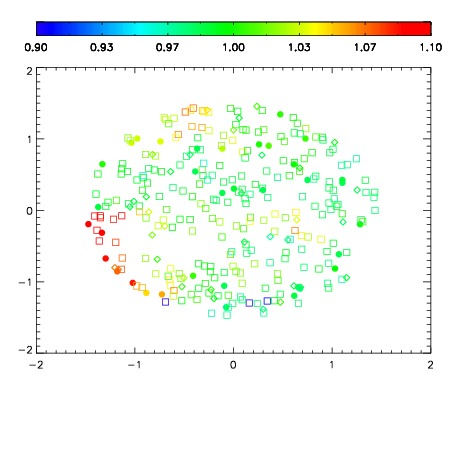
| Spatial sky continuum emission
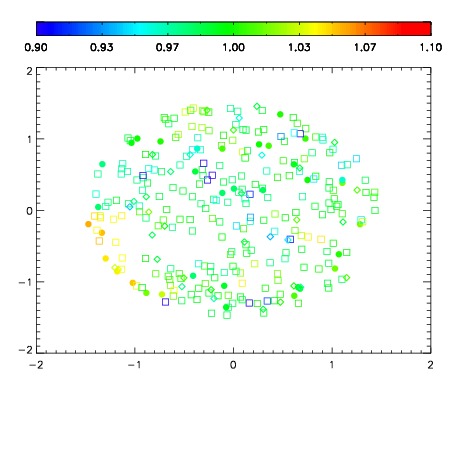
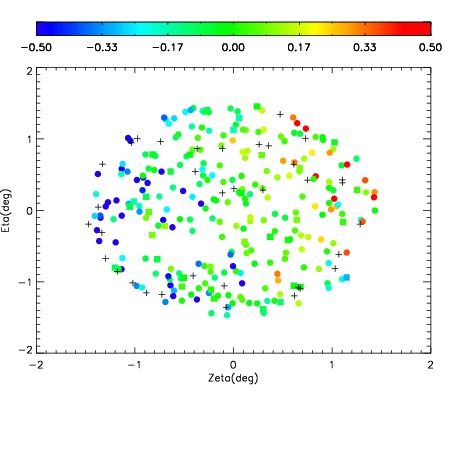
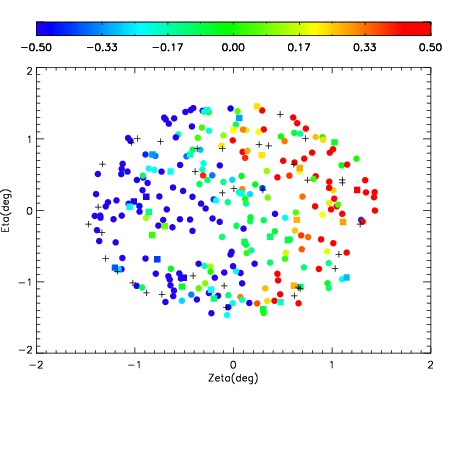
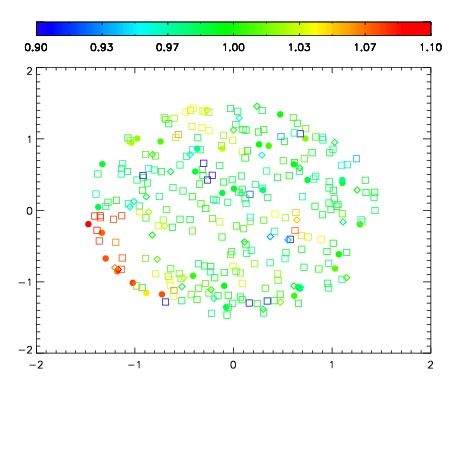
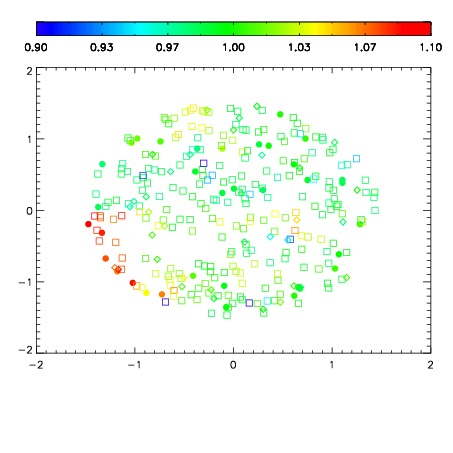
| Spatial sky telluric CO2 absorption deviations (filled: H < 10)
|
| 7290048
| 47
| | Red | Green | Blue
| | z | | 16.82
| | znorm | | 12.64
| | sky | 12.9 | 12.8 | 12.8
| | S/N | 2.0 | 3.9 | 4.7
| | S/N(c) | 1.9 | 3.4 | 4.2
| | SN(E/C) 0.97
|
| 
| 
| 
| 
| 
|
| 7290049
| 47
| | Red | Green | Blue
| | z | | 16.89
| | znorm | | 12.71
| | sky | 12.9 | 12.8 | 12.8
| | S/N | 2.1 | 4.1 | 4.9
| | S/N(c) | 2.0 | 3.5 | 4.6
| | SN(E/C) 0.96
|
| 
| 
| 
| 
| 
|
| 7290050
| 47
| | Red | Green | Blue
| | z | | 17.14
| | znorm | | 12.96
| | sky | 12.8 | 12.7 | 12.8
| | S/N | 2.7 | 4.7 | 5.9
| | S/N(c) | 2.4 | 4.2 | 5.7
| | SN(E/C) 0.99
|
| 
| 
| 
| 
| 
|
| 7290051
| 47
| | Red | Green | Blue
| | z | | 17.46
| | znorm | | 13.28
| | sky | 12.7 | 12.6 | 12.6
| | S/N | 3.6 | 6.0 | 7.9
| | S/N(c) | 3.1 | 5.2 | 7.3
| | SN(E/C) 0.95
|
| 
| 
| 
| 
| 
|
| 7290052
| 47
| | Red | Green | Blue
| | z | | 18.03
| | znorm | | 13.85
| | sky | 12.9 | 12.8 | 12.9
| | S/N | 6.0 | 9.8 | 12.2
| | S/N(c) | 5.0 | 9.1 | 11.5
| | SN(E/C) 0.96
|
| 
| 
| 
| 
| 
|
| 7290053
| 47
| | Red | Green | Blue
| | z | | 17.74
| | znorm | | 13.56
| | sky | 12.5 | 12.4 | 12.4
| | S/N | 4.3 | 7.1 | 9.0
| | S/N(c) | 3.8 | 6.1 | 8.5
| | SN(E/C) 0.97
|
| 
| 
| 
| 
| 
|
| 7290054
| 47
| | Red | Green | Blue
| | z | | 16.30
| | znorm | | 12.12
| | sky | 12.1 | 12.0 | 12.0
| | S/N | 1.1 | 2.0 | 2.4
| | S/N(c) | 1.0 | 1.6 | 2.2
| | SN(E/C) 0.96
|
| 
| 
| 
| 
| 
|
| 7290055
| 47
| | Red | Green | Blue
| | z | | 14.49
| | znorm | | 10.31
| | sky | 11.9 | 11.8 | 11.8
| | S/N | 0.2 | 0.2 | 0.7
| | S/N(c) | 0.2 | 0.2 | 0.5
| | SN(E/C) 0.94
|
| 
| 
| 
| 
| 
|
| 7290056
| 47
| | Red | Green | Blue
| | z | | 16.92
| | znorm | | 12.74
| | sky | 12.3 | 12.2 | 12.2
| | S/N | 2.2 | 3.3 | 4.8
| | S/N(c) | 1.9 | 3.1 | 4.1
| | SN(E/C) 1.00
|
| 
| 
| 
| 
| 
|
| 7290057
| 47
| | Red | Green | Blue
| | z | | 16.12
| | znorm | | 11.94
| | sky | 12.0 | 12.0 | 12.0
| | S/N | 1.0 | 1.3 | 2.5
| | S/N(c) | 0.0 | 0.0 | 0.0
| | SN(E/C) 1.56
|
| 
| 
| 
| 
| 
|
| 7290058
| 47
| | Red | Green | Blue
| | z | | 14.65
| | znorm | | 10.47
| | sky | 11.8 | 11.7 | 11.7
| | S/N | 0.1 | 0.1 | 0.9
| | S/N(c) | 0.2 | 0.4 | 0.6
| | SN(E/C) 0.98
|
| 
| 
| 
| 
| 
|
| 7290059
| 47
| | Red | Green | Blue
| | z | | 14.92
| | znorm | | 10.74
| | sky | 11.9 | 11.8 | 11.8
| | S/N | 0.4 | 0.5 | 0.9
| | S/N(c) | 0.3 | 0.4 | 0.6
| | SN(E/C) 1.02
|
| 
| 
| 
| 
| 
|

