| Red | Green | Blue | |
| z | 17.64 | ||
| znorm | Inf | ||
| sky | -Inf | -NaN | -Inf |
| S/N | 5.7 | 9.3 | 12.9 |
| S/N(c) | 0.0 | 0.0 | 0.0 |
| SN(E/C) |
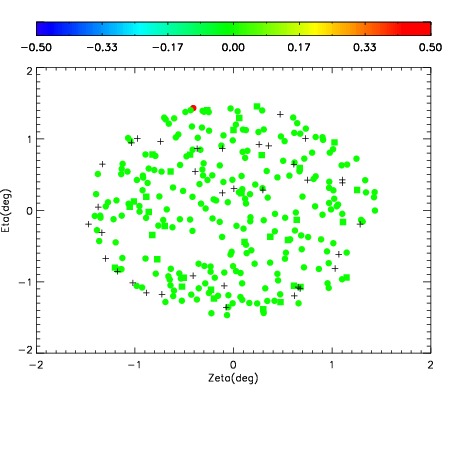
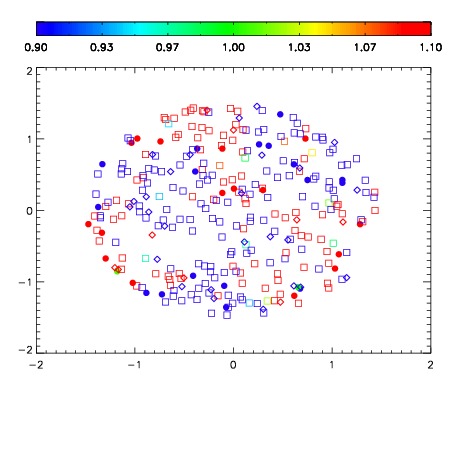
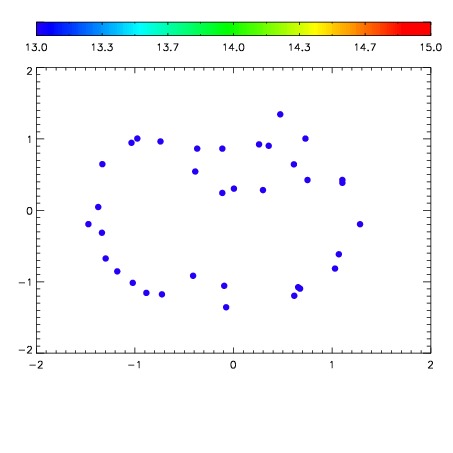

| Frame | Nreads | Zeropoints | Mag plots | Spatial mag deviation | Spatial sky 16325A emission deviations (filled: sky, open: star) | Spatial sky continuum emission | Spatial sky telluric CO2 absorption deviations (filled: H < 10) | |||||||||||||||||||||||
| 0 | 0 |
|
|
|
|
|
|
| IPAIR | NAME | SHIFT | NEWSHIFT | S/N | NAME | SHIFT | NEWSHIFT | S/N |
| 0 | 07290058 | 0.489778 | 0.00000 | 19.3781 | 07290059 | 0.00228283 | 0.487495 | 17.9128 |
| 1 | 07290053 | 0.482761 | 0.00701702 | 116.802 | 07290052 | -0.000211873 | 0.489990 | 136.458 |
| 2 | 07290050 | 0.482597 | 0.00718102 | 86.7346 | 07290051 | 0.00150589 | 0.488272 | 102.915 |
| 3 | 07290049 | 0.482536 | 0.00724202 | 76.8724 | 07290056 | 0.00113372 | 0.488644 | 82.5658 |
| 4 | 07290054 | 0.484652 | 0.00512600 | 54.6815 | 07290048 | 0.00000 | 0.489778 | 76.2191 |