| Red | Green | Blue | |
| z | 17.64 | ||
| znorm | Inf | ||
| sky | -Inf | -Inf | -Inf |
| S/N | 20.0 | 36.0 | 40.5 |
| S/N(c) | 0.0 | 0.0 | 0.0 |
| SN(E/C) |
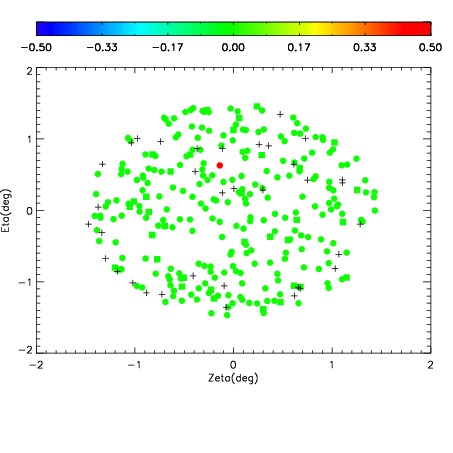
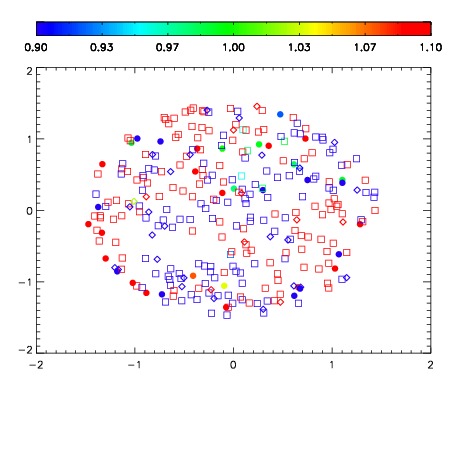
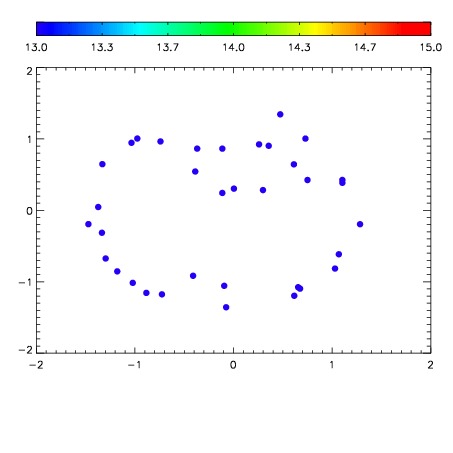

| Frame | Nreads | Zeropoints | Mag plots | Spatial mag deviation | Spatial sky 16325A emission deviations (filled: sky, open: star) | Spatial sky continuum emission | Spatial sky telluric CO2 absorption deviations (filled: H < 10) | |||||||||||||||||||||||
| 0 | 0 |
|
|
|
|
|
|
| IPAIR | NAME | SHIFT | NEWSHIFT | S/N | NAME | SHIFT | NEWSHIFT | S/N |
| 0 | 07510038 | 0.481447 | 0.00000 | 179.950 | 07510036 | 0.00000 | 0.481447 | 193.790 |
| 1 | 07510037 | 0.480946 | 0.000501007 | 179.737 | 07510040 | -0.00206383 | 0.483511 | 176.696 |
| 2 | 07510041 | 0.467004 | 0.0144430 | 173.981 | 07510039 | -0.00102822 | 0.482475 | 176.515 |
| 3 | 07510042 | 0.467253 | 0.0141940 | 170.692 | 07510043 | -0.00234047 | 0.483787 | 173.829 |