| Red | Green | Blue | |
| z | 17.64 | ||
| znorm | Inf | ||
| sky | -Inf | -Inf | -Inf |
| S/N | 14.9 | 28.3 | 30.3 |
| S/N(c) | 0.0 | 0.0 | 0.0 |
| SN(E/C) |
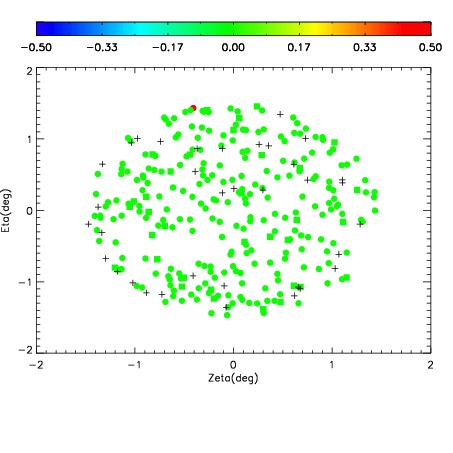
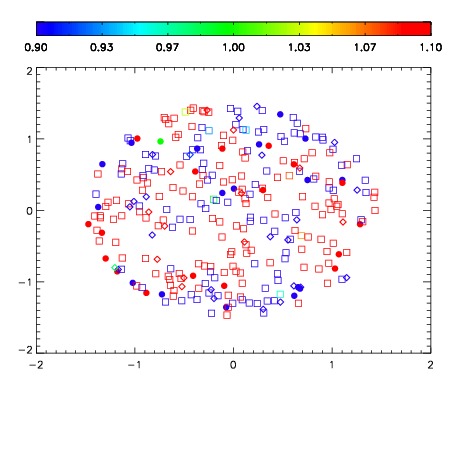
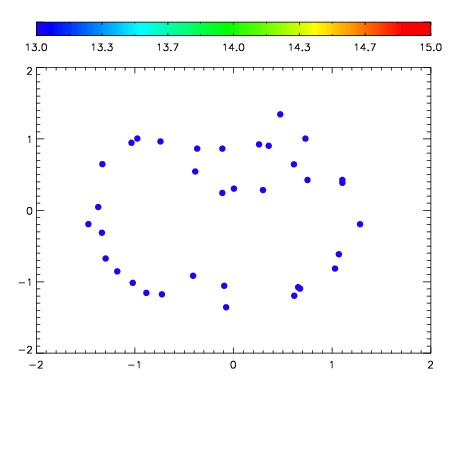

| Frame | Nreads | Zeropoints | Mag plots | Spatial mag deviation | Spatial sky 16325A emission deviations (filled: sky, open: star) | Spatial sky continuum emission | Spatial sky telluric CO2 absorption deviations (filled: H < 10) | |||||||||||||||||||||||
| 0 | 0 |
|
|
|
|
|
|
| IPAIR | NAME | SHIFT | NEWSHIFT | S/N | NAME | SHIFT | NEWSHIFT | S/N |
| 0 | 07880017 | 0.474342 | 0.00000 | 165.353 | 07880015 | 0.00190183 | 0.472440 | 177.465 |
| 1 | 07880016 | 0.473582 | 0.000759989 | 169.254 | 07880014 | -0.000327372 | 0.474669 | 180.421 |
| 2 | 07880012 | 0.468455 | 0.00588700 | 158.944 | 07880018 | 0.00333004 | 0.471012 | 164.939 |
| 3 | 07880013 | 0.468922 | 0.00542000 | 135.301 | 07880011 | 0.00000 | 0.474342 | 129.467 |