| Red | Green | Blue | |
| z | 17.64 | ||
| znorm | Inf | ||
| sky | -NaN | -Inf | -Inf |
| S/N | 22.7 | 39.7 | 43.2 |
| S/N(c) | 0.0 | 0.0 | 0.0 |
| SN(E/C) |
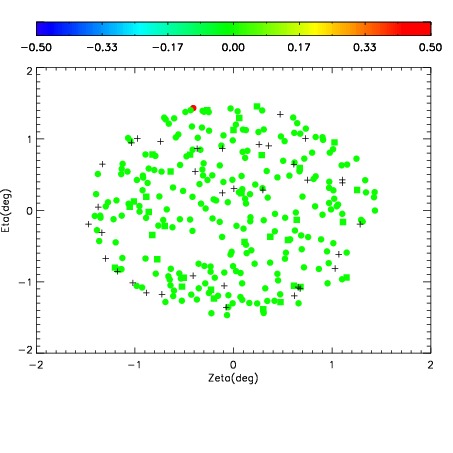
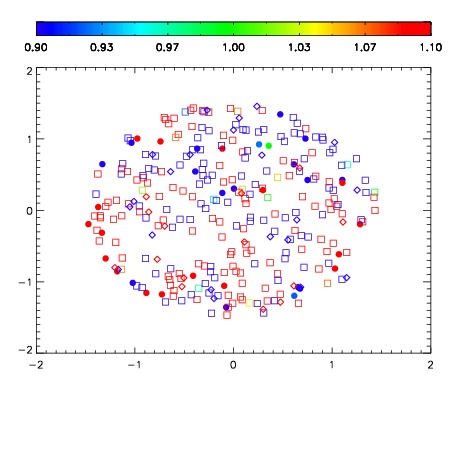
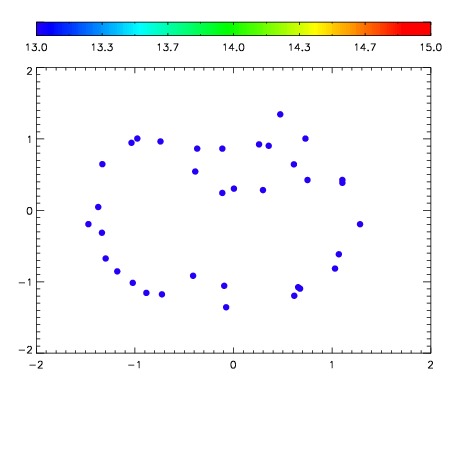

| Frame | Nreads | Zeropoints | Mag plots | Spatial mag deviation | Spatial sky 16325A emission deviations (filled: sky, open: star) | Spatial sky continuum emission | Spatial sky telluric CO2 absorption deviations (filled: H < 10) | |||||||||||||||||||||||
| 0 | 0 |
|
|
|
|
|
|
| IPAIR | NAME | SHIFT | NEWSHIFT | S/N | NAME | SHIFT | NEWSHIFT | S/N |
| 0 | 07890017 | 0.470177 | 0.00000 | 198.171 | 07890015 | -0.000172271 | 0.470349 | 203.721 |
| 1 | 07890013 | 0.467096 | 0.00308099 | 221.857 | 07890011 | 0.00000 | 0.470177 | 205.691 |
| 2 | 07890012 | 0.466710 | 0.00346699 | 219.748 | 07890018 | -8.29611e-05 | 0.470260 | 205.495 |
| 3 | 07890016 | 0.469572 | 0.000604987 | 190.650 | 07890014 | -0.000444701 | 0.470622 | 198.549 |