| Red | Green | Blue | |
| z | 17.64 | ||
| znorm | Inf | ||
| sky | -Inf | -Inf | -Inf |
| S/N | 27.1 | 45.3 | 51.9 |
| S/N(c) | 0.0 | 0.0 | 0.0 |
| SN(E/C) |

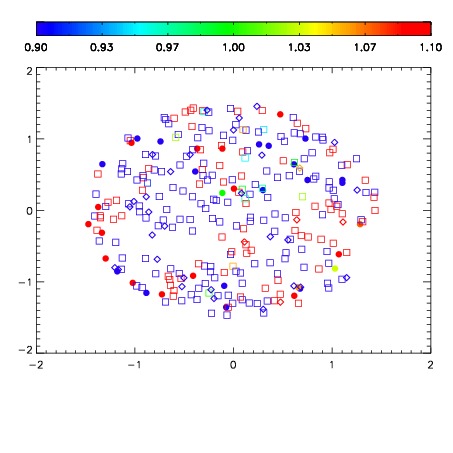
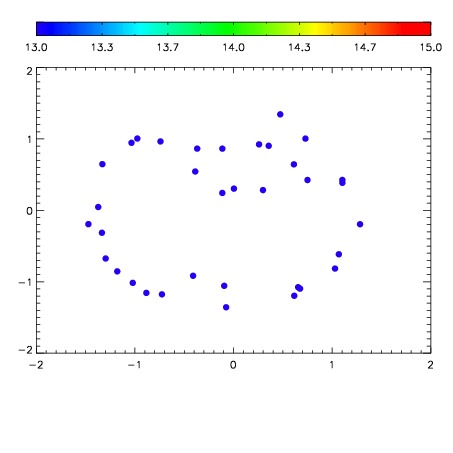

| Frame | Nreads | Zeropoints | Mag plots | Spatial mag deviation | Spatial sky 16325A emission deviations (filled: sky, open: star) | Spatial sky continuum emission | Spatial sky telluric CO2 absorption deviations (filled: H < 10) | |||||||||||||||||||||||
| 0 | 0 |
|
|
|
|
|
|
| IPAIR | NAME | SHIFT | NEWSHIFT | S/N | NAME | SHIFT | NEWSHIFT | S/N |
| 0 | 10230090 | 0.500461 | 0.00000 | 233.279 | 10230091 | 0.00522690 | 0.495234 | 237.641 |
| 1 | 10230089 | 0.499924 | 0.000536978 | 231.219 | 10230088 | 0.00398621 | 0.496475 | 230.840 |
| 2 | 10230085 | 0.499813 | 0.000647992 | 227.854 | 10230084 | 0.00000 | 0.500461 | 224.647 |
| 3 | 10230086 | 0.499994 | 0.000466973 | 220.608 | 10230087 | 0.00450302 | 0.495958 | 223.896 |