| Red | Green | Blue | |
| z | 17.64 | ||
| znorm | Inf | ||
| sky | -Inf | -Inf | -Inf |
| S/N | 24.5 | 42.0 | 47.5 |
| S/N(c) | 0.0 | 0.0 | 0.0 |
| SN(E/C) |
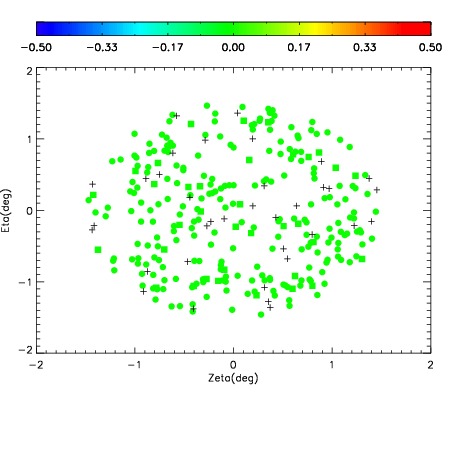
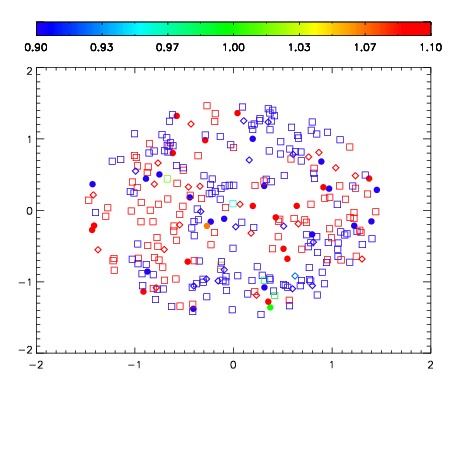


| Frame | Nreads | Zeropoints | Mag plots | Spatial mag deviation | Spatial sky 16325A emission deviations (filled: sky, open: star) | Spatial sky continuum emission | Spatial sky telluric CO2 absorption deviations (filled: H < 10) | |||||||||||||||||||||||
| 0 | 0 |
|
|
|
|
|
|
| IPAIR | NAME | SHIFT | NEWSHIFT | S/N | NAME | SHIFT | NEWSHIFT | S/N |
| 0 | 07520043 | 0.474373 | 0.00000 | 205.970 | 07520040 | 0.000276950 | 0.474096 | 210.607 |
| 1 | 07520039 | 0.471868 | 0.00250500 | 218.986 | 07520041 | -0.00258821 | 0.476961 | 215.733 |
| 2 | 07520042 | 0.473092 | 0.00128102 | 217.193 | 07520044 | -0.000730833 | 0.475104 | 215.074 |
| 3 | 07520038 | 0.471307 | 0.00306600 | 200.395 | 07520037 | 0.00000 | 0.474373 | 197.174 |