| Red | Green | Blue | |
| z | 17.64 | ||
| znorm | Inf | ||
| sky | -NaN | -Inf | -Inf |
| S/N | 25.4 | 42.8 | 45.8 |
| S/N(c) | 0.0 | 0.0 | 0.0 |
| SN(E/C) |
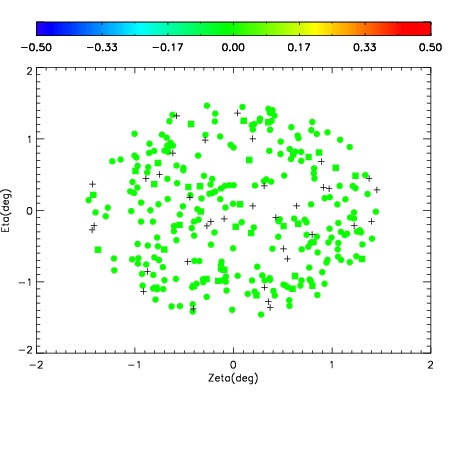
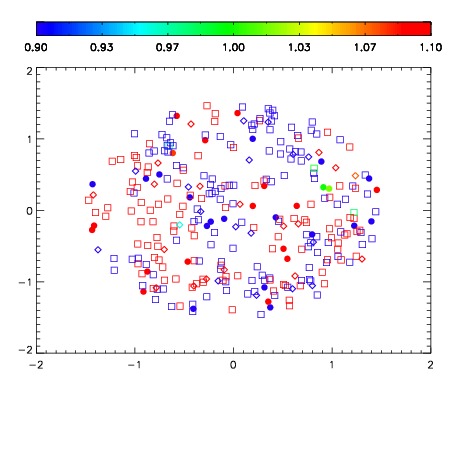
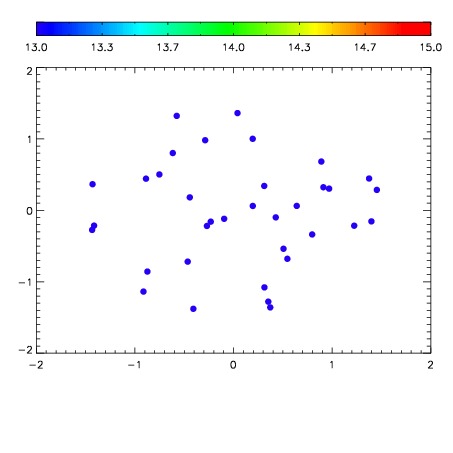

| Frame | Nreads | Zeropoints | Mag plots | Spatial mag deviation | Spatial sky 16325A emission deviations (filled: sky, open: star) | Spatial sky continuum emission | Spatial sky telluric CO2 absorption deviations (filled: H < 10) | |||||||||||||||||||||||
| 0 | 0 |
|
|
|
|
|
|
| IPAIR | NAME | SHIFT | NEWSHIFT | S/N | NAME | SHIFT | NEWSHIFT | S/N |
| 0 | 07870016 | 0.468893 | 0.00000 | 228.648 | 07870013 | -0.00173028 | 0.470623 | 224.274 |
| 1 | 07870015 | 0.468064 | 0.000828981 | 232.538 | 07870014 | -0.00379632 | 0.472689 | 226.991 |
| 2 | 07870012 | 0.466050 | 0.00284299 | 215.517 | 07870017 | -0.000603915 | 0.469497 | 220.664 |
| 3 | 07870011 | 0.466675 | 0.00221798 | 213.746 | 07870010 | 0.00000 | 0.468893 | 204.072 |