| Red | Green | Blue | |
| z | 17.64 | ||
| znorm | Inf | ||
| sky | -Inf | -Inf | -Inf |
| S/N | 18.2 | 34.8 | 39.1 |
| S/N(c) | 0.0 | 0.0 | 0.0 |
| SN(E/C) |
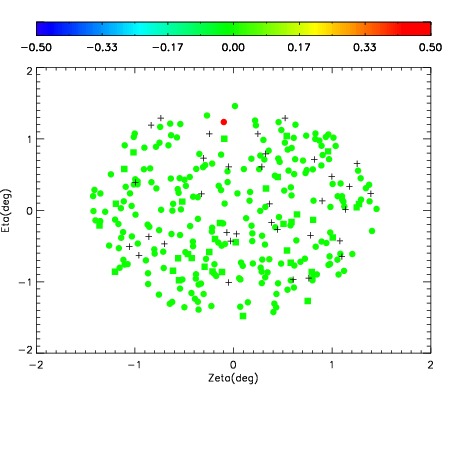
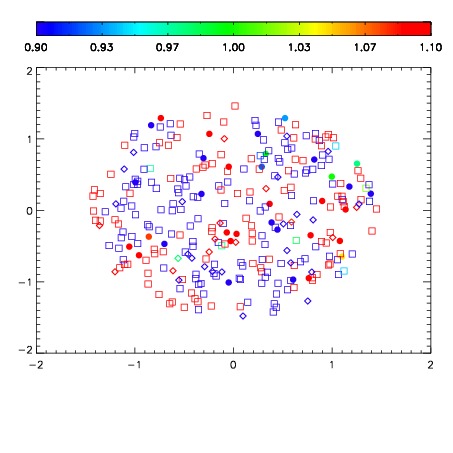


| Frame | Nreads | Zeropoints | Mag plots | Spatial mag deviation | Spatial sky 16325A emission deviations (filled: sky, open: star) | Spatial sky continuum emission | Spatial sky telluric CO2 absorption deviations (filled: H < 10) | |||||||||||||||||||||||
| 0 | 0 |
|
|
|
|
|
|
| IPAIR | NAME | SHIFT | NEWSHIFT | S/N | NAME | SHIFT | NEWSHIFT | S/N |
| 0 | 07220067 | 0.479991 | 0.00000 | 114.205 | 07220060 | 0.00319726 | 0.476794 | 112.647 |
| 1 | 07220059 | 0.474042 | 0.00594899 | 121.815 | 07220057 | 0.00000 | 0.479991 | 114.099 |
| 2 | 07220066 | 0.479857 | 0.000133991 | 108.458 | 07220068 | 0.000848473 | 0.479143 | 111.565 |
| 3 | 07220058 | 0.474517 | 0.00547400 | 99.6922 | 07220065 | 0.000589678 | 0.479401 | 106.880 |
| 4 | 07220062 | 0.478310 | 0.00168100 | 95.1497 | 07220061 | 0.000505442 | 0.479486 | 102.200 |
| 5 | 07220063 | 0.479388 | 0.000602990 | 89.1315 | 07220064 | 0.00203908 | 0.477952 | 96.3799 |