| Red | Green | Blue | |
| z | 17.64 | ||
| znorm | Inf | ||
| sky | -NaN | -NaN | -Inf |
| S/N | 24.8 | 43.8 | 51.4 |
| S/N(c) | 0.0 | 0.0 | 0.0 |
| SN(E/C) |
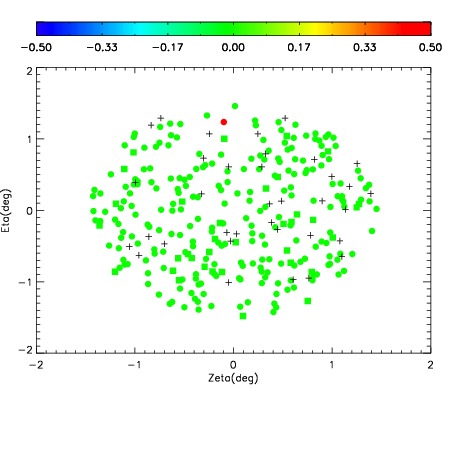
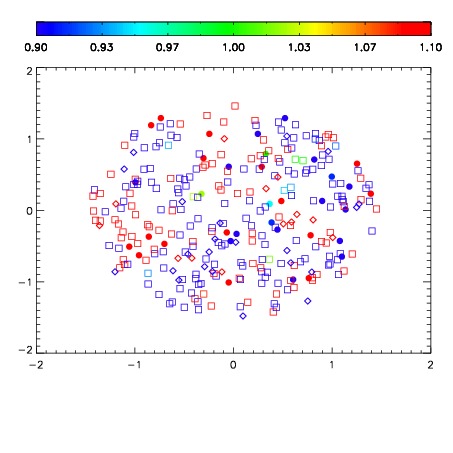
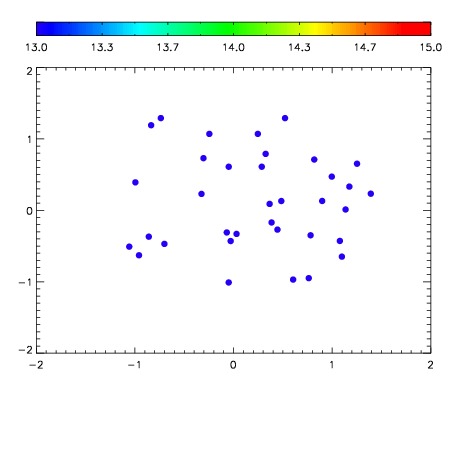

| Frame | Nreads | Zeropoints | Mag plots | Spatial mag deviation | Spatial sky 16325A emission deviations (filled: sky, open: star) | Spatial sky continuum emission | Spatial sky telluric CO2 absorption deviations (filled: H < 10) | |||||||||||||||||||||||
| 0 | 0 |
|
|
|
|
|
|
| IPAIR | NAME | SHIFT | NEWSHIFT | S/N | NAME | SHIFT | NEWSHIFT | S/N |
| 0 | 07500059 | 0.490310 | 0.00000 | 149.134 | 07500060 | 0.0113157 | 0.478994 | 142.173 |
| 1 | 07500058 | 0.488691 | 0.00161901 | 140.267 | 07500057 | -6.03095e-05 | 0.490370 | 140.589 |
| 2 | 07500055 | 0.486636 | 0.00367400 | 140.041 | 07500056 | 0.00229914 | 0.488011 | 140.051 |
| 3 | 07500054 | 0.485594 | 0.00471601 | 138.776 | 07500053 | 0.00000 | 0.490310 | 129.149 |