| Red | Green | Blue | |
| z | 17.64 | ||
| znorm | Inf | ||
| sky | -Inf | -Inf | -Inf |
| S/N | 24.2 | 43.1 | 46.7 |
| S/N(c) | 0.0 | 0.0 | 0.0 |
| SN(E/C) |


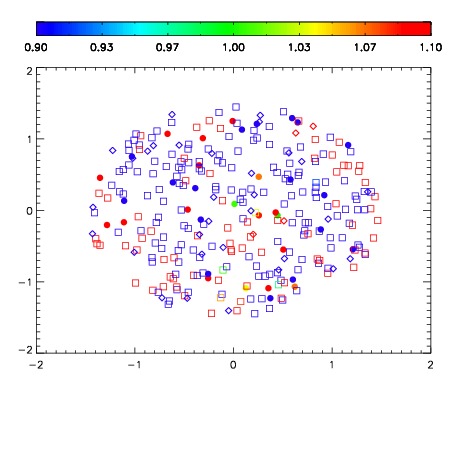
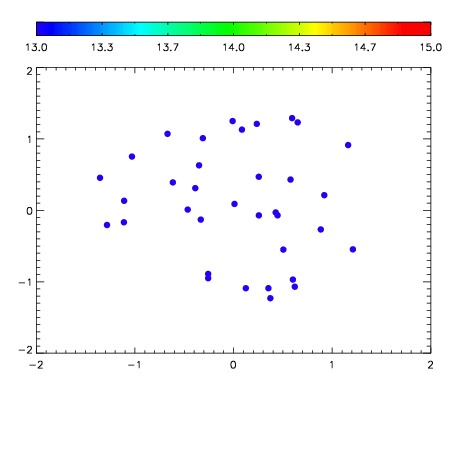

| Frame | Nreads | Zeropoints | Mag plots | Spatial mag deviation | Spatial sky 16325A emission deviations (filled: sky, open: star) | Spatial sky continuum emission | Spatial sky telluric CO2 absorption deviations (filled: H < 10) | |||||||||||||||||||||||
| 0 | 0 |
|
|
|
|
|
|
| IPAIR | NAME | SHIFT | NEWSHIFT | S/N | NAME | SHIFT | NEWSHIFT | S/N |
| 0 | 11360091 | 0.477824 | 0.00000 | 228.534 | 11360088 | -0.00159420 | 0.479418 | 223.020 |
| 1 | 11360087 | 0.476904 | 0.000919998 | 229.928 | 11360089 | -0.000974524 | 0.478799 | 231.613 |
| 2 | 11360086 | 0.476379 | 0.00144500 | 228.725 | 11360092 | -0.00125772 | 0.479082 | 227.419 |
| 3 | 11360090 | 0.477003 | 0.000820994 | 227.813 | 11360085 | 0.00000 | 0.477824 | 222.248 |