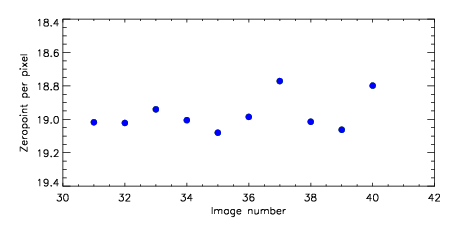
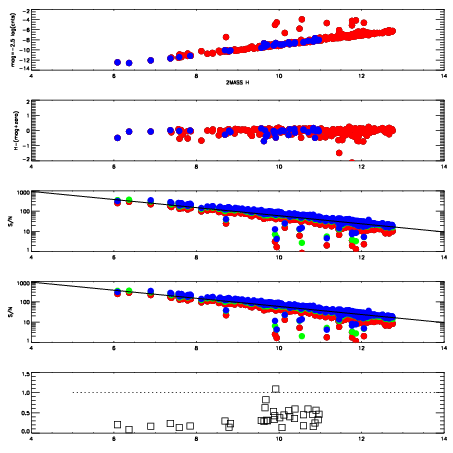
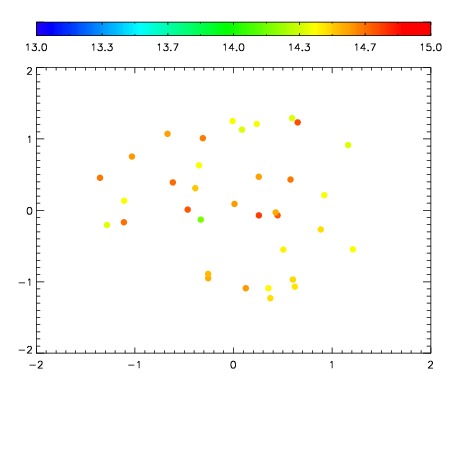
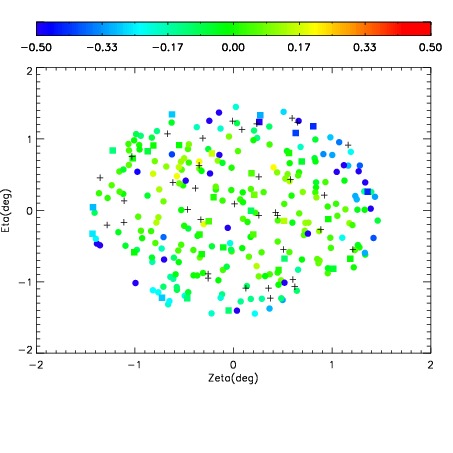
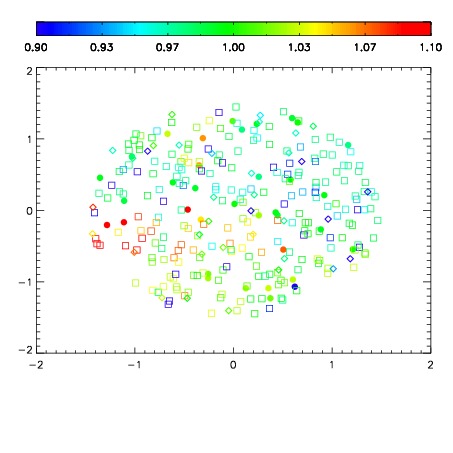
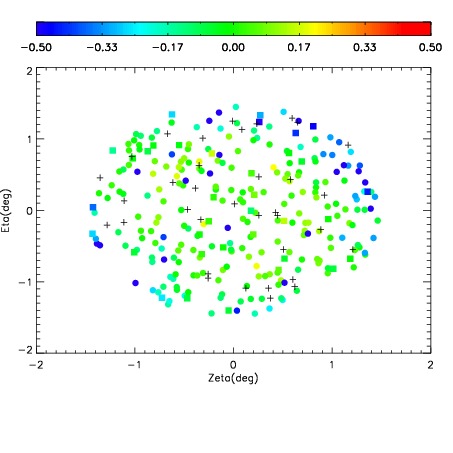
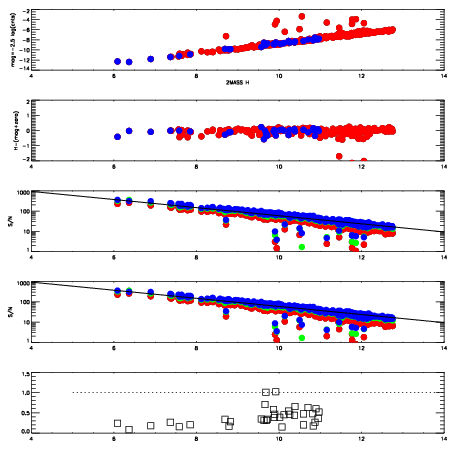
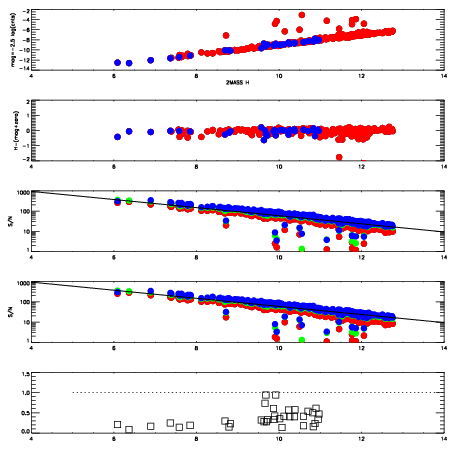
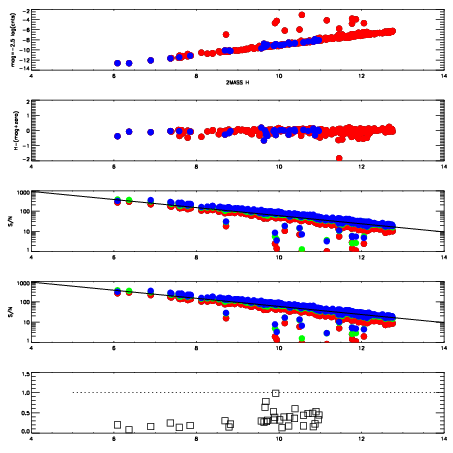
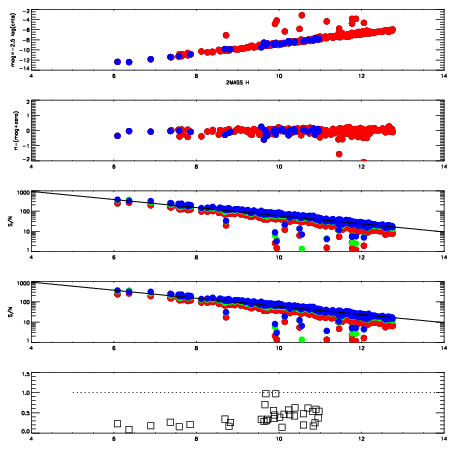
| Frame | Nreads | Zeropoints | Mag plots
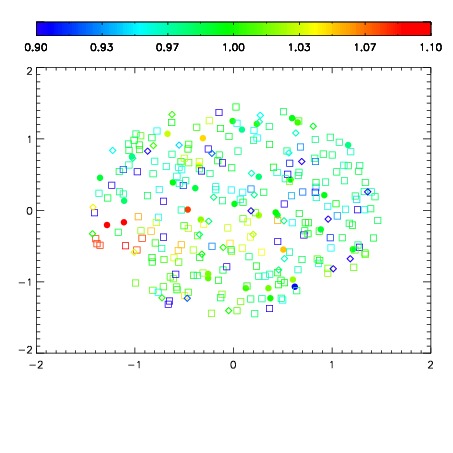
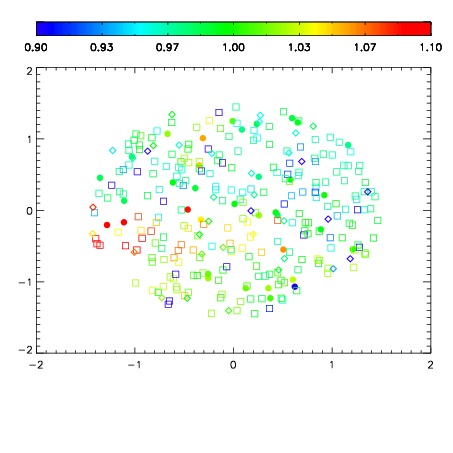
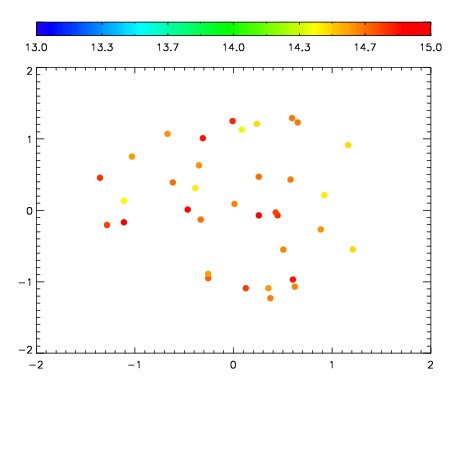
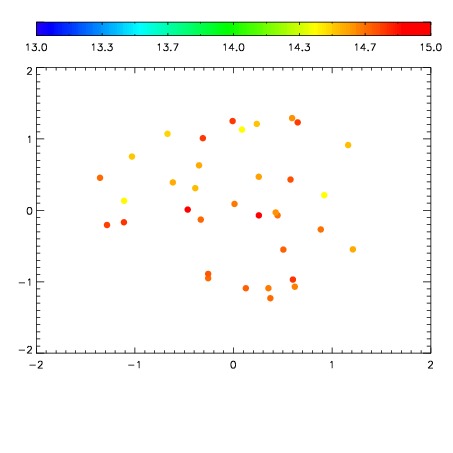
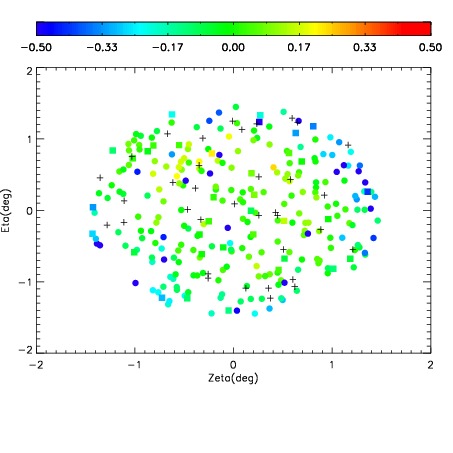
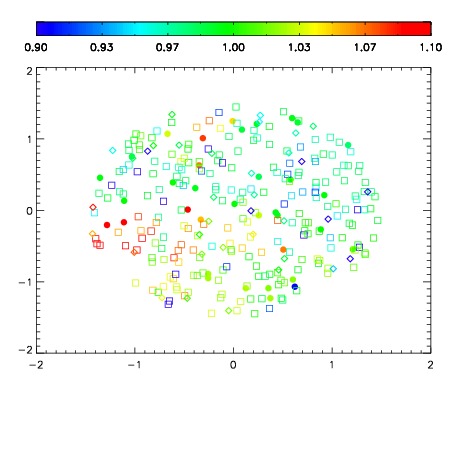
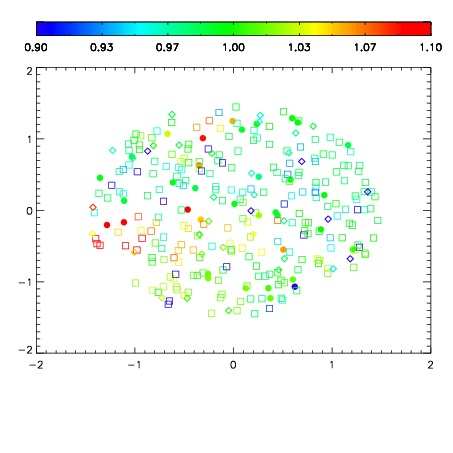
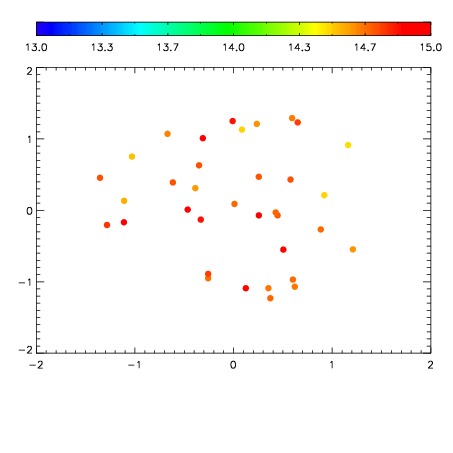
| Spatial mag deviation
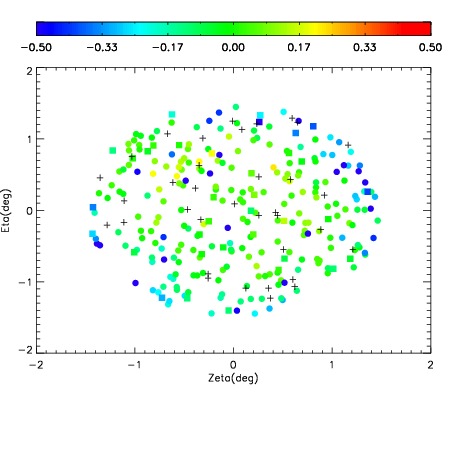
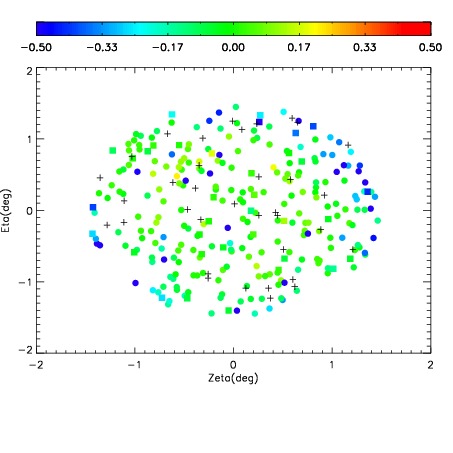
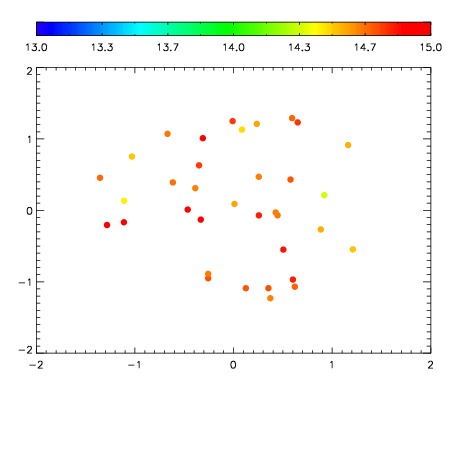
| Spatial sky 16325A emission deviations (filled: sky, open: star)
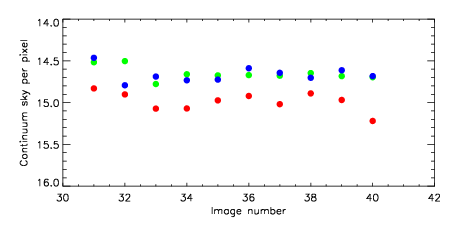
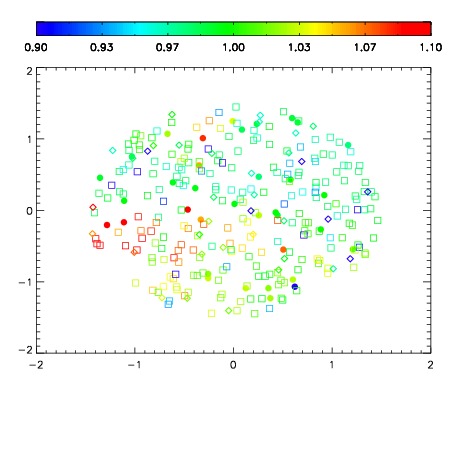
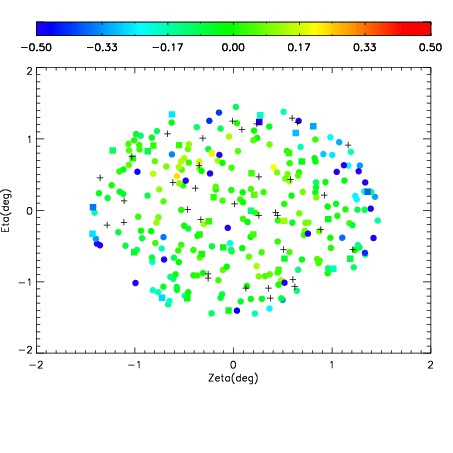
| Spatial sky continuum emission
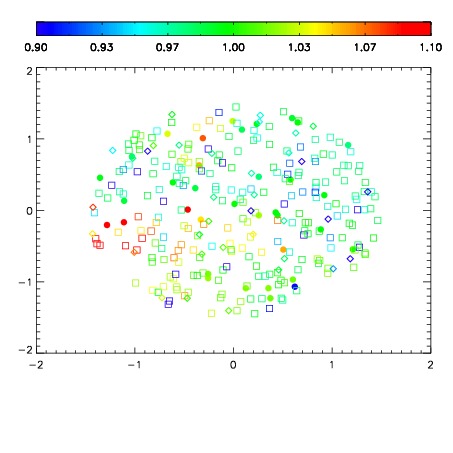
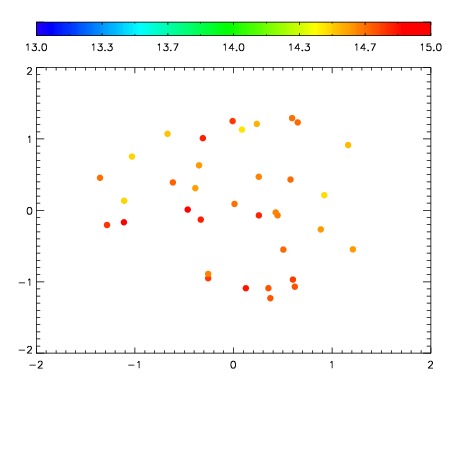
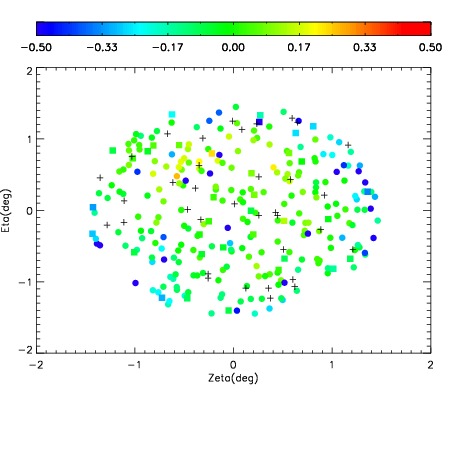
| Spatial sky telluric CO2 absorption deviations (filled: H < 10)
|
| 11370031
| 47
| | Red | Green | Blue
| | z | | 19.02
| | znorm | | 14.84
| | sky | 14.8 | 14.5 | 14.5
| | S/N | 14.4 | 23.7 | 24.9
| | S/N(c) | 12.4 | 21.7 | 23.4
| | SN(E/C) 0.33
|
| 
| 
| 
| 
| 
|
| 11370032
| 47
| | Red | Green | Blue
| | z | | 19.02
| | znorm | | 14.84
| | sky | 14.9 | 14.5 | 14.8
| | S/N | 14.1 | 23.5 | 24.7
| | S/N(c) | 12.4 | 21.8 | 23.1
| | SN(E/C) 0.33
|
| 
| 
| 
| 
| 
|
| 11370033
| 47
| | Red | Green | Blue
| | z | | 18.94
| | znorm | | 14.76
| | sky | 15.1 | 14.8 | 14.7
| | S/N | 13.8 | 23.1 | 24.0
| | S/N(c) | 12.0 | 21.0 | 22.4
| | SN(E/C) 0.34
|
| 
| 
| 
| 
| 
|
| 11370034
| 47
| | Red | Green | Blue
| | z | | 19.00
| | znorm | | 14.82
| | sky | 15.1 | 14.7 | 14.7
| | S/N | 14.3 | 23.0 | 24.4
| | S/N(c) | 12.1 | 20.8 | 22.8
| | SN(E/C) 0.35
|
| 
| 
| 
| 
| 
|
| 11370035
| 47
| | Red | Green | Blue
| | z | | 19.08
| | znorm | | 14.90
| | sky | 15.0 | 14.7 | 14.7
| | S/N | 15.1 | 24.1 | 25.5
| | S/N(c) | 12.9 | 21.9 | 23.9
| | SN(E/C) 0.33
|
| 
| 
| 
| 
| 
|
| 11370036
| 47
| | Red | Green | Blue
| | z | | 18.99
| | znorm | | 14.81
| | sky | 14.9 | 14.7 | 14.6
| | S/N | 14.0 | 22.5 | 24.3
| | S/N(c) | 12.0 | 20.5 | 22.4
| | SN(E/C) 0.33
|
| 
| 
| 
| 
| 
|
| 11370037
| 47
| | Red | Green | Blue
| | z | | 18.77
| | znorm | | 14.59
| | sky | 15.0 | 14.7 | 14.6
| | S/N | 12.3 | 20.3 | 21.5
| | S/N(c) | 10.3 | 17.9 | 19.9
| | SN(E/C) 0.36
|
| 
| 
| 
| 
| 
|
| 11370038
| 47
| | Red | Green | Blue
| | z | | 19.01
| | znorm | | 14.83
| | sky | 14.9 | 14.6 | 14.7
| | S/N | 14.6 | 23.2 | 25.0
| | S/N(c) | 12.5 | 21.0 | 23.4
| | SN(E/C) 0.34
|
| 
| 
| 
| 
| 
|
| 11370039
| 47
| | Red | Green | Blue
| | z | | 19.06
| | znorm | | 14.88
| | sky | 15.0 | 14.7 | 14.6
| | S/N | 15.1 | 23.9 | 25.3
| | S/N(c) | 13.1 | 21.7 | 23.6
| | SN(E/C) 0.31
|
| 
| 
| 
| 
| 
|
| 11370040
| 47
| | Red | Green | Blue
| | z | | 18.80
| | znorm | | 14.62
| | sky | 15.2 | 14.7 | 14.7
| | S/N | 12.3 | 20.3 | 21.6
| | S/N(c) | 10.6 | 18.0 | 20.1
| | SN(E/C) 0.36
|
| 
| 
| 
| 
| 
|