| Red | Green | Blue | |
| z | 17.64 | ||
| znorm | Inf | ||
| sky | -Inf | -Inf | -Inf |
| S/N | 26.8 | 46.0 | 50.1 |
| S/N(c) | 0.0 | 0.0 | 0.0 |
| SN(E/C) |
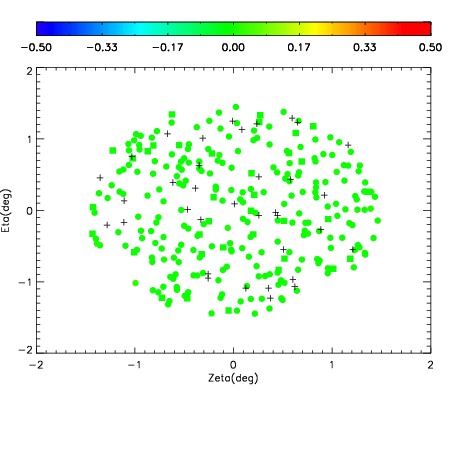
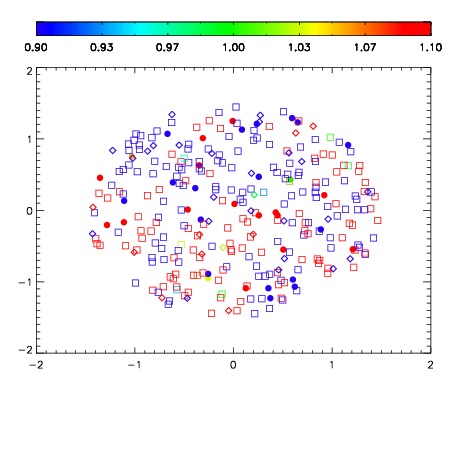
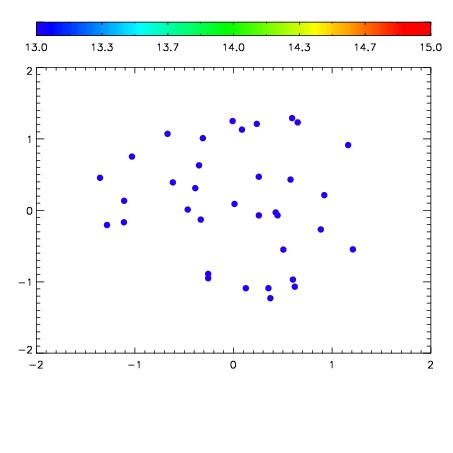

| Frame | Nreads | Zeropoints | Mag plots | Spatial mag deviation | Spatial sky 16325A emission deviations (filled: sky, open: star) | Spatial sky continuum emission | Spatial sky telluric CO2 absorption deviations (filled: H < 10) | |||||||||||||||||||||||
| 0 | 0 |
|
|
|
|
|
|
| IPAIR | NAME | SHIFT | NEWSHIFT | S/N | NAME | SHIFT | NEWSHIFT | S/N |
| 0 | 11370033 | 0.473378 | 0.00000 | 227.048 | 11370039 | -0.00177715 | 0.475155 | 236.211 |
| 1 | 11370032 | 0.472161 | 0.00121701 | 234.301 | 11370035 | -0.00281219 | 0.476190 | 237.556 |
| 2 | 11370036 | 0.472905 | 0.000472993 | 228.694 | 11370031 | 0.00000 | 0.473378 | 236.586 |
| 3 | 11370040 | 0.473282 | 9.59933e-05 | 209.683 | 11370038 | -0.00231496 | 0.475693 | 232.668 |
| 4 | 11370037 | 0.473266 | 0.000111997 | 208.953 | 11370034 | -0.00351166 | 0.476890 | 232.113 |