| Red | Green | Blue | |
| z | 17.64 | ||
| znorm | Inf | ||
| sky | -Inf | -Inf | -Inf |
| S/N | 26.4 | 45.1 | 50.4 |
| S/N(c) | 0.0 | 0.0 | 0.0 |
| SN(E/C) |
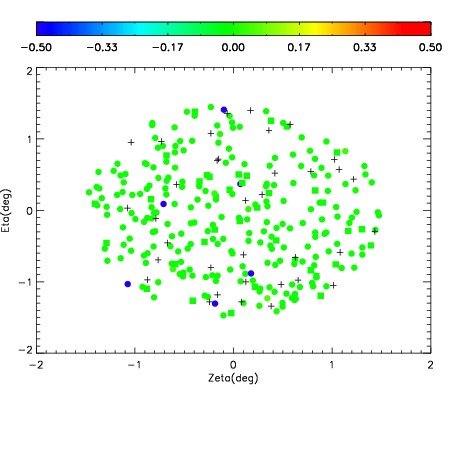
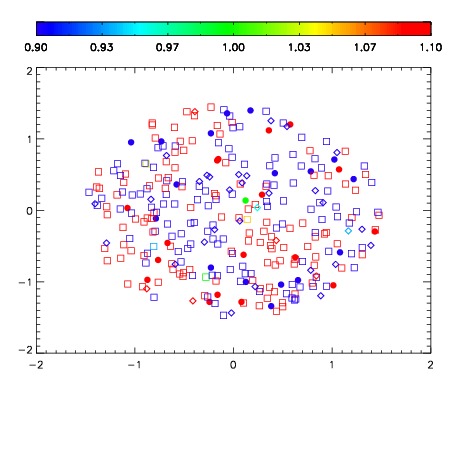
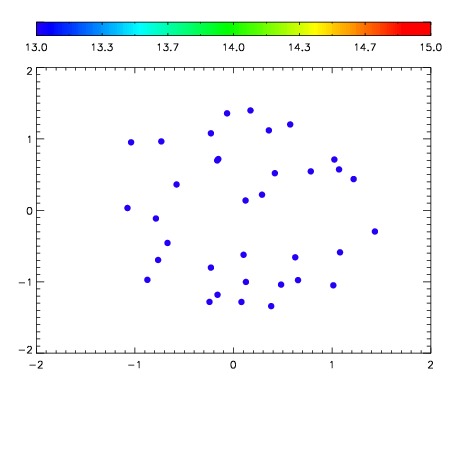

| Frame | Nreads | Zeropoints | Mag plots | Spatial mag deviation | Spatial sky 16325A emission deviations (filled: sky, open: star) | Spatial sky continuum emission | Spatial sky telluric CO2 absorption deviations (filled: H < 10) | |||||||||||||||||||||||
| 0 | 0 |
|
|
|
|
|
|
| IPAIR | NAME | SHIFT | NEWSHIFT | S/N | NAME | SHIFT | NEWSHIFT | S/N |
| 0 | 08480039 | 0.489200 | 0.00000 | 229.049 | 08480037 | 0.00000 | 0.489200 | 230.415 |
| 1 | 08480043 | 0.487607 | 0.00159299 | 236.276 | 08480044 | 0.00269322 | 0.486507 | 237.880 |
| 2 | 08480042 | 0.486084 | 0.00311598 | 236.087 | 08480041 | 0.000612400 | 0.488588 | 234.381 |
| 3 | 08480038 | 0.488044 | 0.00115600 | 228.956 | 08480040 | 0.00220644 | 0.486994 | 229.856 |