| Red | Green | Blue | |
| z | 17.64 | ||
| znorm | Inf | ||
| sky | -Inf | -Inf | -Inf |
| S/N | 16.4 | 30.7 | 33.5 |
| S/N(c) | 0.0 | 0.0 | 0.0 |
| SN(E/C) |


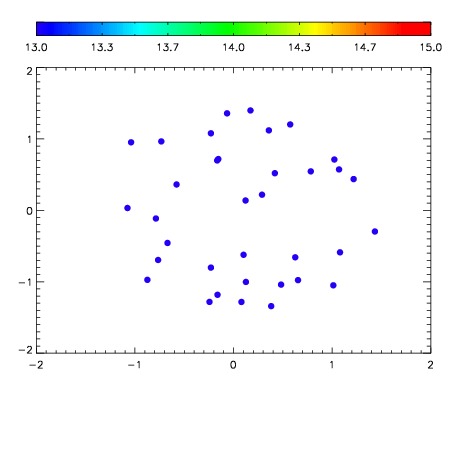

| Frame | Nreads | Zeropoints | Mag plots | Spatial mag deviation | Spatial sky 16325A emission deviations (filled: sky, open: star) | Spatial sky continuum emission | Spatial sky telluric CO2 absorption deviations (filled: H < 10) | |||||||||||||||||||||||
| 0 | 0 |
|
|
|
|
|
|
| IPAIR | NAME | SHIFT | NEWSHIFT | S/N | NAME | SHIFT | NEWSHIFT | S/N |
| 0 | 08700024 | 0.479321 | 0.00000 | 153.617 | 08700026 | 0.00256280 | 0.476758 | 178.018 |
| 1 | 08700023 | 0.477936 | 0.00138500 | 194.672 | 08700022 | 0.00000 | 0.479321 | 196.871 |
| 2 | 08700028 | 0.478919 | 0.000402004 | 155.540 | 08700029 | 0.00129833 | 0.478023 | 178.910 |
| 3 | 08700027 | 0.478796 | 0.000524998 | 153.035 | 08700025 | 0.00232466 | 0.476996 | 155.125 |