| Red | Green | Blue | |
| z | 17.64 | ||
| znorm | Inf | ||
| sky | -NaN | -Inf | -Inf |
| S/N | 27.3 | 46.0 | 50.0 |
| S/N(c) | 0.0 | 0.0 | 0.0 |
| SN(E/C) |
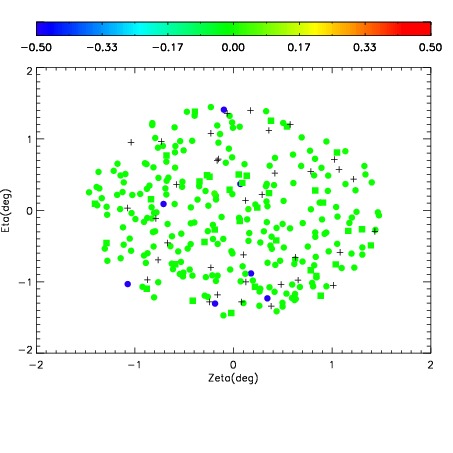
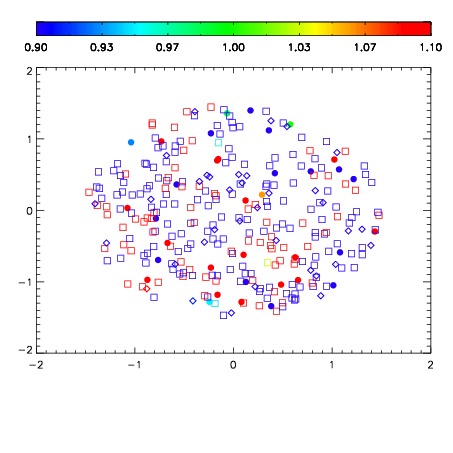
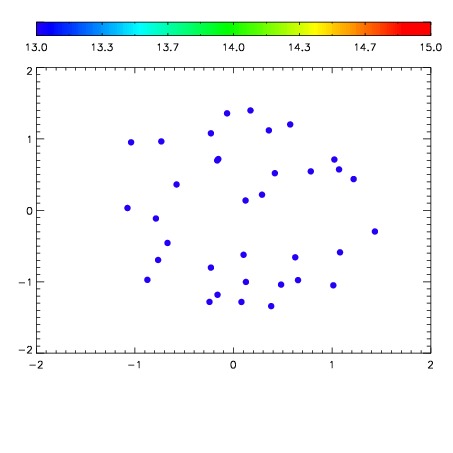

| Frame | Nreads | Zeropoints | Mag plots | Spatial mag deviation | Spatial sky 16325A emission deviations (filled: sky, open: star) | Spatial sky continuum emission | Spatial sky telluric CO2 absorption deviations (filled: H < 10) | |||||||||||||||||||||||
| 0 | 0 |
|
|
|
|
|
|
| IPAIR | NAME | SHIFT | NEWSHIFT | S/N | NAME | SHIFT | NEWSHIFT | S/N |
| 0 | 08760031 | 0.483069 | 0.00000 | 228.158 | 08760033 | 0.00432425 | 0.478745 | 227.647 |
| 1 | 08760028 | 0.481965 | 0.00110400 | 231.748 | 08760026 | 0.00000 | 0.483069 | 230.180 |
| 2 | 08760027 | 0.481435 | 0.00163400 | 231.684 | 08760029 | 0.00280984 | 0.480259 | 229.620 |
| 3 | 08760032 | 0.482668 | 0.000400990 | 230.111 | 08760030 | 0.00333776 | 0.479731 | 228.486 |