| Red | Green | Blue | |
| z | 17.64 | ||
| znorm | Inf | ||
| sky | -Inf | -Inf | -Inf |
| S/N | 22.8 | 39.7 | 45.0 |
| S/N(c) | 0.0 | 0.0 | 0.0 |
| SN(E/C) |
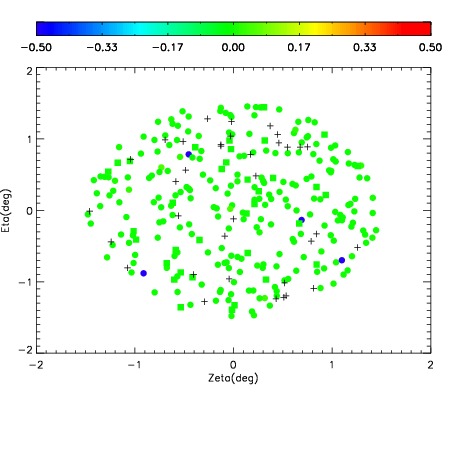
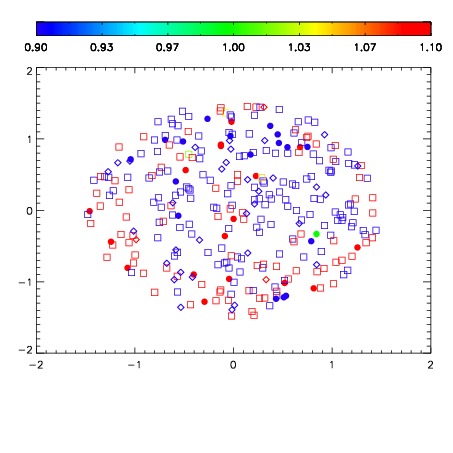
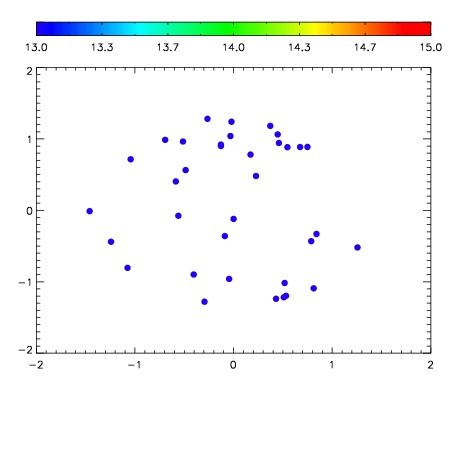

| Frame | Nreads | Zeropoints | Mag plots | Spatial mag deviation | Spatial sky 16325A emission deviations (filled: sky, open: star) | Spatial sky continuum emission | Spatial sky telluric CO2 absorption deviations (filled: H < 10) | |||||||||||||||||||||||
| 0 | 0 |
|
|
|
|
|
|
| IPAIR | NAME | SHIFT | NEWSHIFT | S/N | NAME | SHIFT | NEWSHIFT | S/N |
| 0 | 08450050 | 0.494015 | 0.00000 | 205.121 | 08450051 | 0.00173110 | 0.492284 | 197.918 |
| 1 | 08450049 | 0.493150 | 0.000865012 | 205.278 | 08450048 | -0.00130776 | 0.495323 | 200.265 |
| 2 | 08450046 | 0.488366 | 0.00564900 | 191.184 | 08450047 | 0.000144973 | 0.493870 | 194.592 |
| 3 | 08450045 | 0.488830 | 0.00518501 | 167.522 | 08450044 | 0.00000 | 0.494015 | 179.065 |