| Red | Green | Blue | |
| z | 17.64 | ||
| znorm | Inf | ||
| sky | -NaN | -Inf | -Inf |
| S/N | 20.4 | 35.2 | 39.5 |
| S/N(c) | 0.0 | 0.0 | 0.0 |
| SN(E/C) |
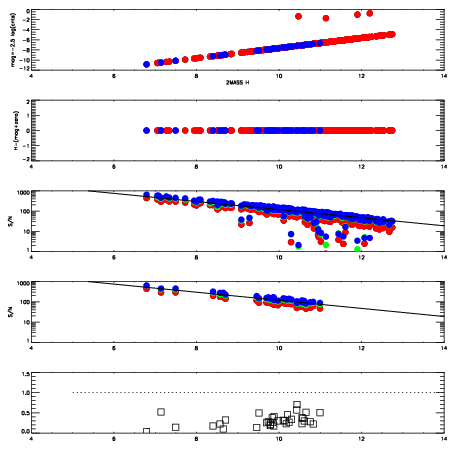
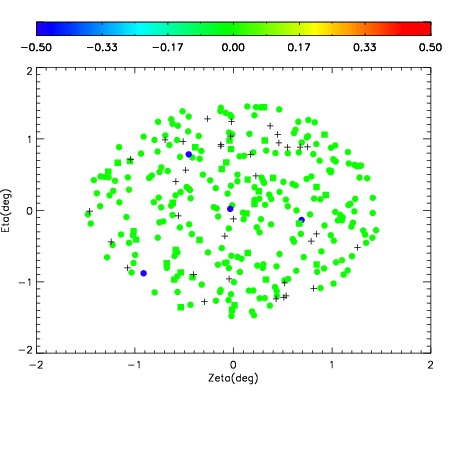

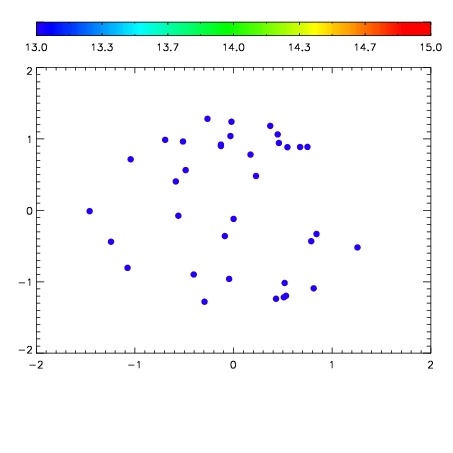

| Frame | Nreads | Zeropoints | Mag plots | Spatial mag deviation | Spatial sky 16325A emission deviations (filled: sky, open: star) | Spatial sky continuum emission | Spatial sky telluric CO2 absorption deviations (filled: H < 10) | |||||||||||||||||||||||
| 0 | 0 |
|
|
|
|
|
|
| IPAIR | NAME | SHIFT | NEWSHIFT | S/N | NAME | SHIFT | NEWSHIFT | S/N |
| 0 | 08730017 | 0.483077 | 0.00000 | 196.164 | 08730018 | -1.89824e-05 | 0.483096 | 207.984 |
| 1 | 08730013 | 0.477330 | 0.00574699 | 190.644 | 08730011 | 0.00000 | 0.483077 | 193.855 |
| 2 | 08730012 | 0.476768 | 0.00630900 | 188.116 | 08730014 | 0.00436204 | 0.478715 | 174.170 |
| 3 | 08730016 | 0.482361 | 0.000716001 | 159.621 | 08730015 | 0.00481610 | 0.478261 | 166.805 |