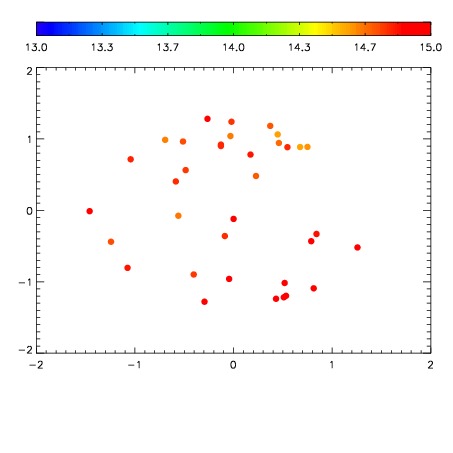
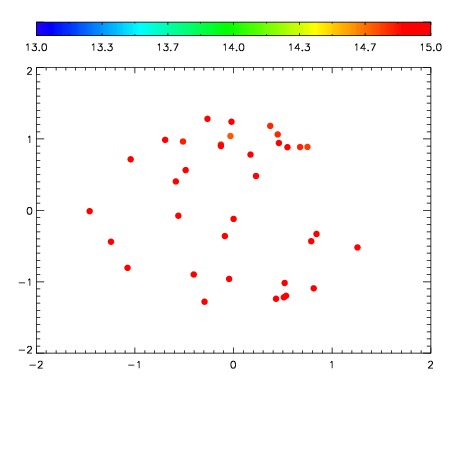
| Frame | Nreads | Zeropoints | Mag plots
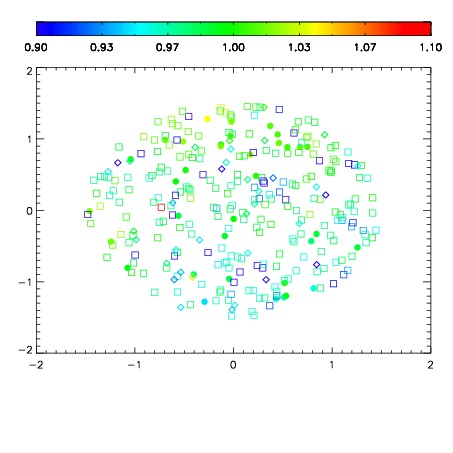
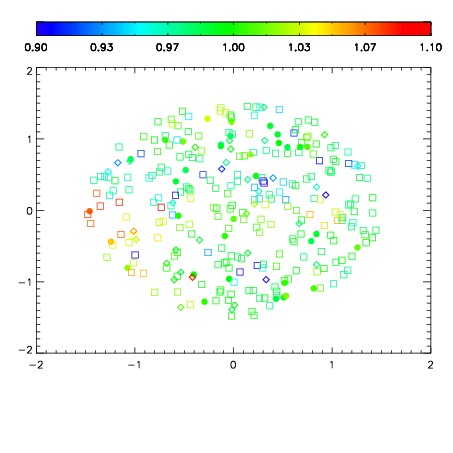
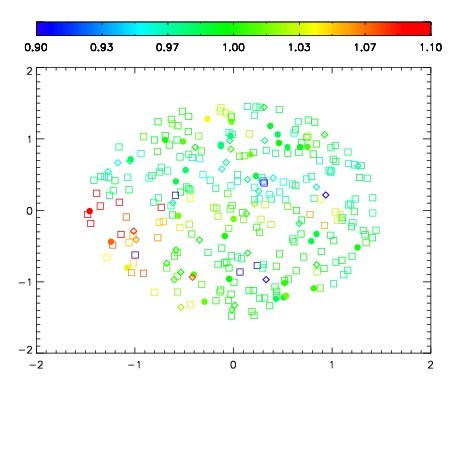
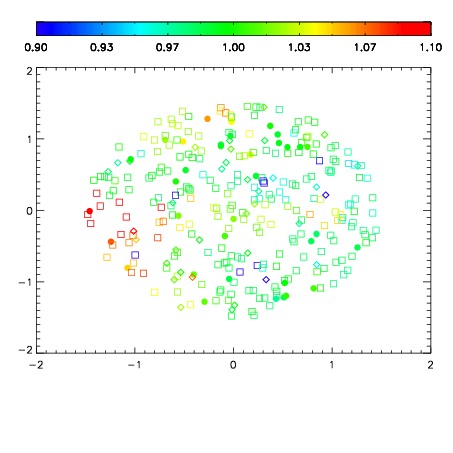
| Spatial mag deviation
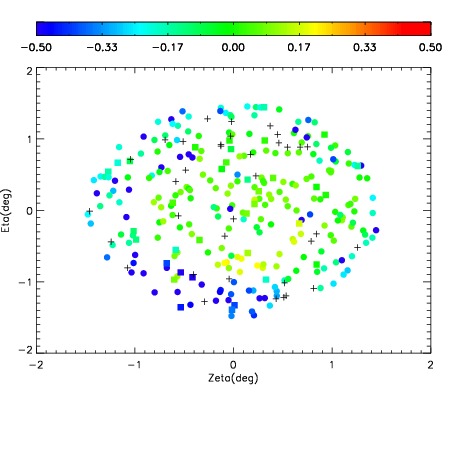
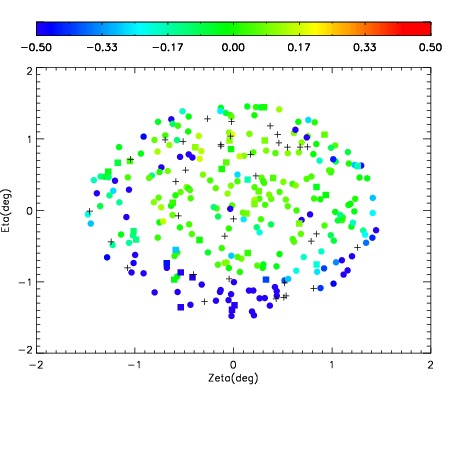
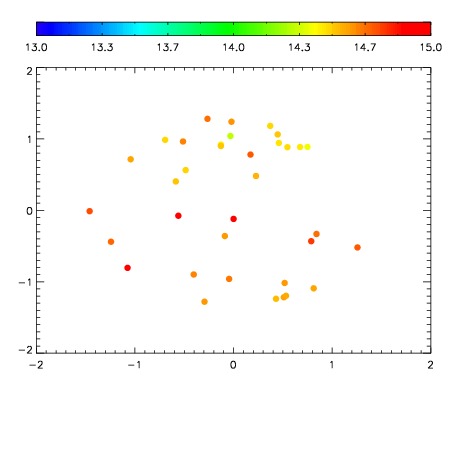
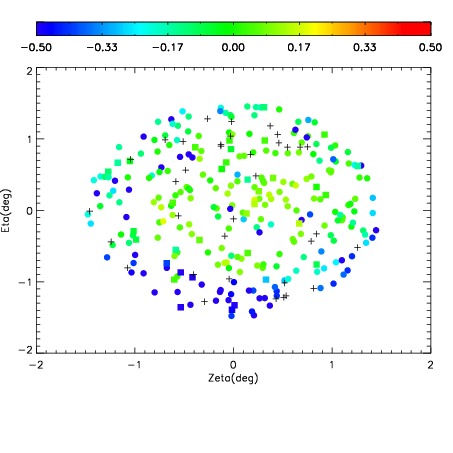
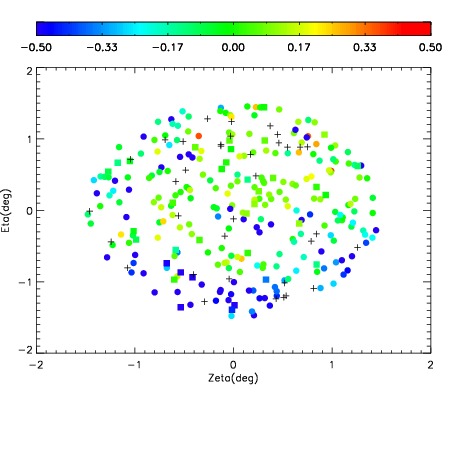
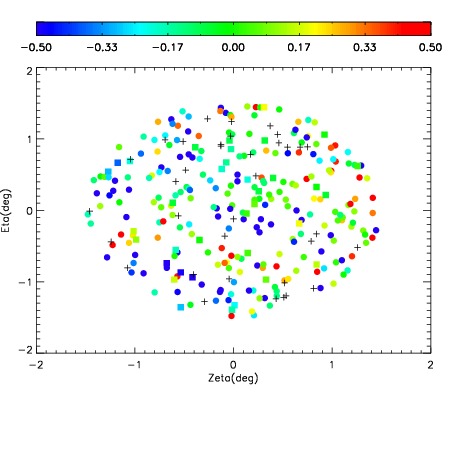
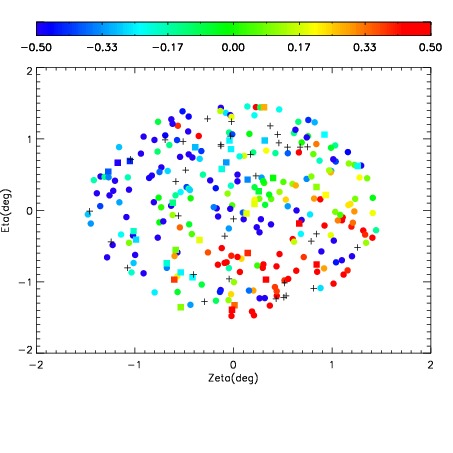
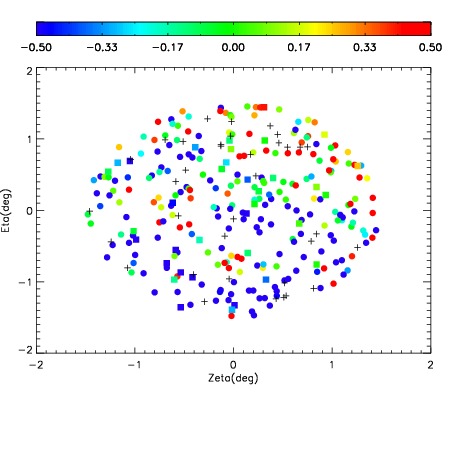
| Spatial sky 16325A emission deviations (filled: sky, open: star)
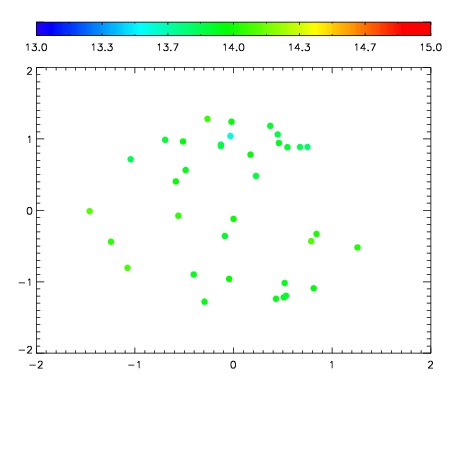
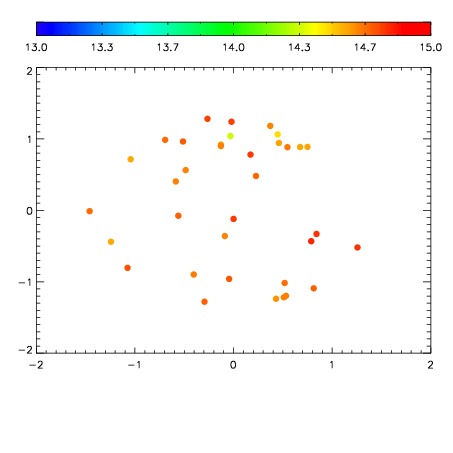
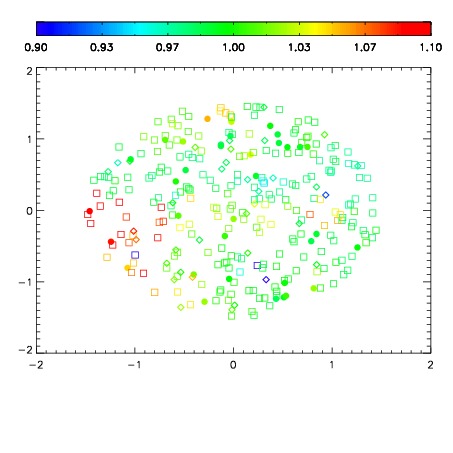
| Spatial sky continuum emission
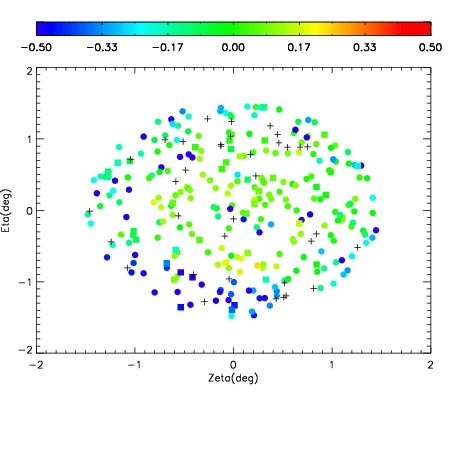
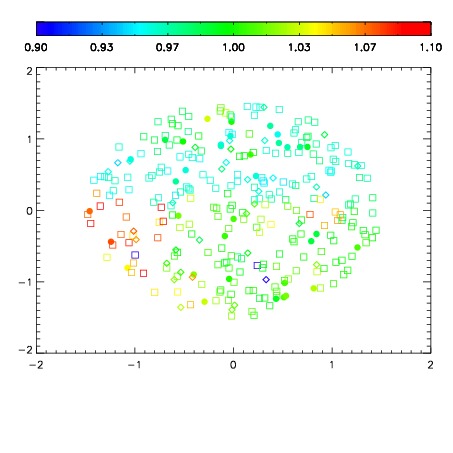
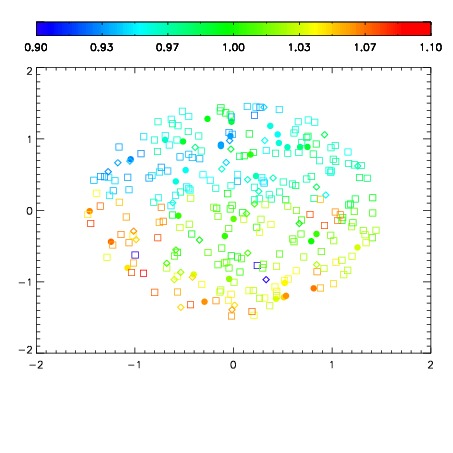
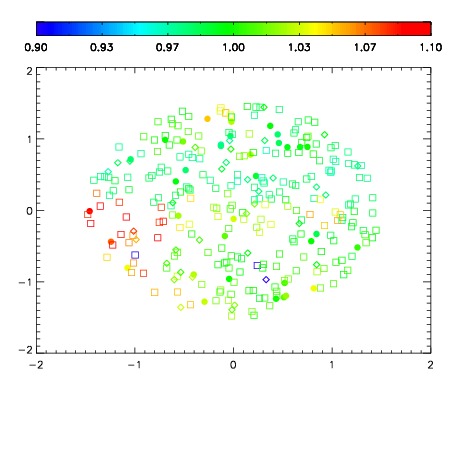
| Spatial sky telluric CO2 absorption deviations (filled: H < 10)
|
| 8780010
| 47
| | Red | Green | Blue
| | z | | 18.47
| | znorm | | 14.29
| | sky | 14.1 | 13.9 | 13.9
| | S/N | 8.5 | 15.3 | 15.4
| | S/N(c) | 7.8 | 14.0 | 14.5
| | SN(E/C) 0.50
|
| 
| 
| 
| 
| 
|
| 8780011
| 47
| | Red | Green | Blue
| | z | | 17.85
| | znorm | | 13.67
| | sky | 14.6 | 14.6 | 14.7
| | S/N | 4.9 | 9.5 | 10.4
| | S/N(c) | 4.4 | 8.8 | 9.8
| | SN(E/C) 0.59
|
| 
| 
| 
| 
| 
|
| 8780012
| 47
| | Red | Green | Blue
| | z | | 16.66
| | znorm | | 12.48
| | sky | 14.7 | 14.7 | 15.1
| | S/N | 2.0 | 4.3 | 5.3
| | S/N(c) | 1.7 | 3.8 | 4.9
| | SN(E/C) 0.85
|
| 
| 
| 
| 
| 
|
| 8780013
| 47
| | Red | Green | Blue
| | z | | 17.01
| | znorm | | 12.83
| | sky | 14.8 | 14.8 | 15.3
| | S/N | 2.5 | 5.6 | 6.7
| | S/N(c) | 2.2 | 5.0 | 6.2
| | SN(E/C) 0.77
|
| 
| 
| 
| 
| 
|
| 8780014
| 47
| | Red | Green | Blue
| | z | | 15.46
| | znorm | | 11.28
| | sky | 14.7 | 14.8 | 15.4
| | S/N | 0.7 | 1.6 | 2.4
| | S/N(c) | 0.7 | 1.5 | 2.3
| | SN(E/C) 0.93
|
| 
| 
| 
| 
| 
|
| 8780015
| 47
| | Red | Green | Blue
| | z | | 14.23
| | znorm | | 10.05
| | sky | 14.8 | 14.9 | 15.7
| | S/N | 0.2 | 0.7 | 1.5
| | S/N(c) | 0.2 | 0.7 | 1.5
| | SN(E/C) 0.92
|
| 
| 
| 
| 
| 
|
| 8780016
| 47
| | Red | Green | Blue
| | z | | 14.09
| | znorm | | 9.91
| | sky | 14.8 | 15.0 | 15.7
| | S/N | 0.2 | 0.5 | 1.9
| | S/N(c) | 0.2 | 0.5 | 1.7
| | SN(E/C) 0.89
|
| 
| 
| 
| 
| 
|
| 8780017
| 47
| | Red | Green | Blue
| | z | | 13.05
| | znorm | | 8.87
| | sky | 14.8 | 15.1 | 15.9
| | S/N | 0.1 | 0.0 | 1.0
| | S/N(c) | 0.0 | 0.0 | 0.0
| | SN(E/C) 2.28
|
| 
| 
| 
| 
| 
|