| Red | Green | Blue | |
| z | 17.64 | ||
| znorm | Inf | ||
| sky | -Inf | -Inf | -Inf |
| S/N | 6.0 | 11.7 | 12.8 |
| S/N(c) | 0.0 | 0.0 | 0.0 |
| SN(E/C) |

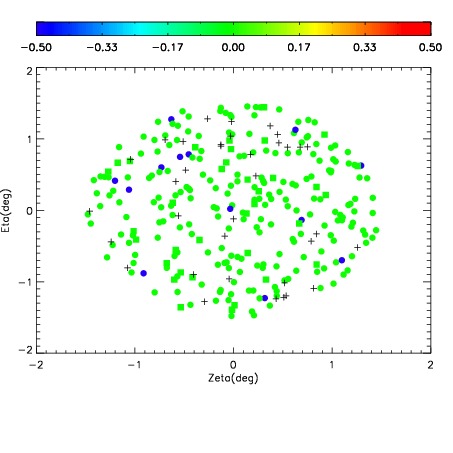
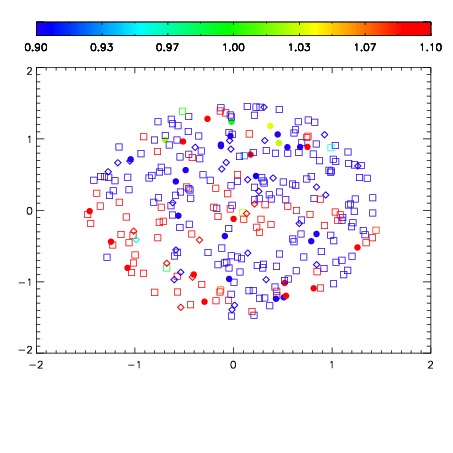
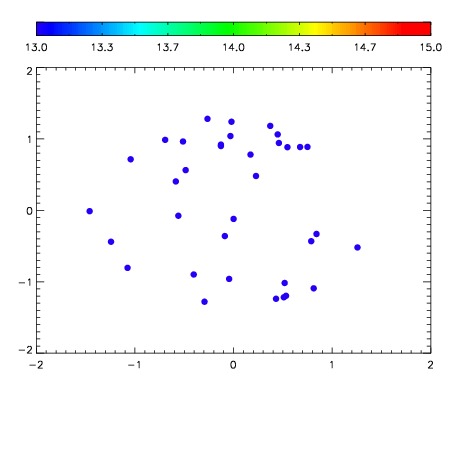

| Frame | Nreads | Zeropoints | Mag plots | Spatial mag deviation | Spatial sky 16325A emission deviations (filled: sky, open: star) | Spatial sky continuum emission | Spatial sky telluric CO2 absorption deviations (filled: H < 10) | |||||||||||||||||||||||
| 0 | 0 |
|
|
|
|
|
|
| IPAIR | NAME | SHIFT | NEWSHIFT | S/N | NAME | SHIFT | NEWSHIFT | S/N |
| 0 | 08780012 | 0.479176 | 0.00000 | 59.8152 | 08780013 | 0.00142409 | 0.477752 | 73.4976 |
| 1 | 08780011 | 0.478932 | 0.000244021 | 114.373 | 08780010 | 0.00000 | 0.479176 | 141.074 |
| 2 | 08780015 | 0.474345 | 0.00483102 | 15.4827 | 08780014 | 0.00146587 | 0.477710 | 34.5313 |