| Red | Green | Blue | |
| z | 17.64 | ||
| znorm | Inf | ||
| sky | -Inf | -Inf | -Inf |
| S/N | 28.5 | 53.0 | 60.2 |
| S/N(c) | 0.0 | 0.0 | 0.0 |
| SN(E/C) |
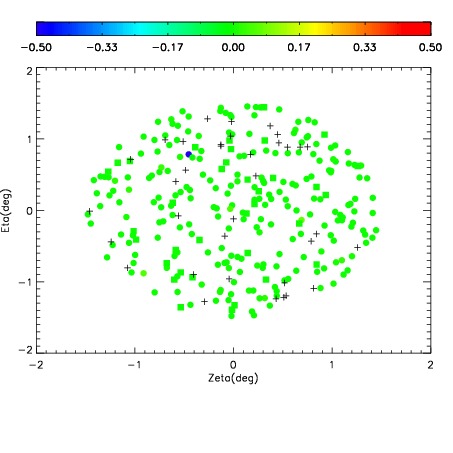
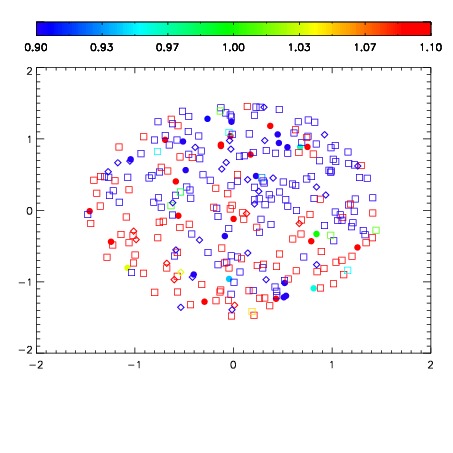
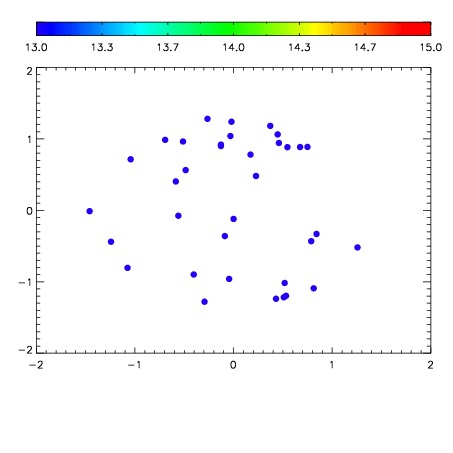

| Frame | Nreads | Zeropoints | Mag plots | Spatial mag deviation | Spatial sky 16325A emission deviations (filled: sky, open: star) | Spatial sky continuum emission | Spatial sky telluric CO2 absorption deviations (filled: H < 10) | |||||||||||||||||||||||
| 0 | 0 |
|
|
|
|
|
|
| IPAIR | NAME | SHIFT | NEWSHIFT | S/N | NAME | SHIFT | NEWSHIFT | S/N |
| 0 | 11100106 | 0.479983 | 0.00000 | 166.875 | 11100104 | 0.00172947 | 0.478254 | 173.618 |
| 1 | 11100101 | 0.478263 | 0.00172001 | 188.210 | 11100096 | -0.000323022 | 0.480306 | 190.201 |
| 2 | 11100094 | 0.478358 | 0.00162500 | 185.199 | 11100103 | 0.00135953 | 0.478623 | 184.475 |
| 3 | 11100097 | 0.476886 | 0.00309700 | 181.427 | 11100092 | 0.00000 | 0.479983 | 184.470 |
| 4 | 11100102 | 0.478557 | 0.00142601 | 177.185 | 11100100 | 0.000325582 | 0.479657 | 184.221 |
| 5 | 11100093 | 0.477747 | 0.00223601 | 174.314 | 11100099 | 0.000636125 | 0.479347 | 179.649 |
| 6 | 11100098 | 0.477668 | 0.00231501 | 172.556 | 11100095 | -0.000504549 | 0.480488 | 176.237 |
| 7 | 11100105 | 0.479145 | 0.000838012 | 169.393 | 11100107 | 0.00135718 | 0.478626 | 174.812 |