| Red | Green | Blue | |
| z | 17.64 | ||
| znorm | Inf | ||
| sky | -NaN | -Inf | -Inf |
| S/N | 27.7 | 48.6 | 51.2 |
| S/N(c) | 0.0 | 0.0 | 0.0 |
| SN(E/C) |
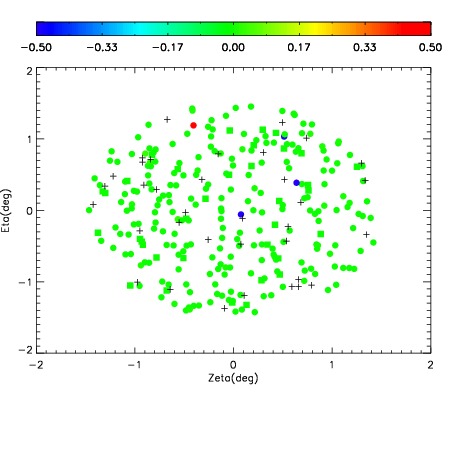

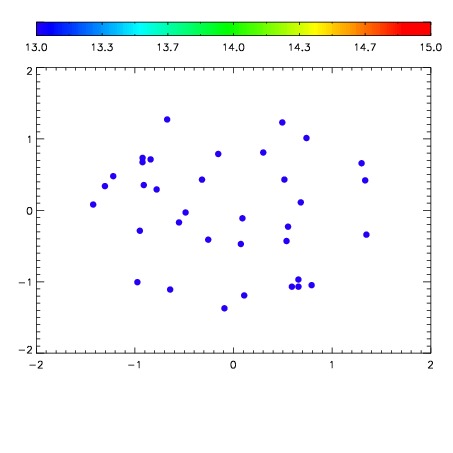

| Frame | Nreads | Zeropoints | Mag plots | Spatial mag deviation | Spatial sky 16325A emission deviations (filled: sky, open: star) | Spatial sky continuum emission | Spatial sky telluric CO2 absorption deviations (filled: H < 10) | |||||||||||||||||||||||
| 0 | 0 |
|
|
|
|
|
|
| IPAIR | NAME | SHIFT | NEWSHIFT | S/N | NAME | SHIFT | NEWSHIFT | S/N |
| 0 | 08420032 | 0.493164 | 0.00000 | 223.386 | 08420030 | 0.00230957 | 0.490854 | 222.739 |
| 1 | 08420028 | 0.492353 | 0.000811011 | 223.925 | 08420033 | 0.00401563 | 0.489148 | 224.637 |
| 2 | 08420031 | 0.493083 | 8.10027e-05 | 220.845 | 08420029 | 0.00370000 | 0.489464 | 222.169 |
| 3 | 08420027 | 0.492812 | 0.000351995 | 220.449 | 08420026 | 0.00000 | 0.493164 | 215.840 |