| Red | Green | Blue | |
| z | 17.64 | ||
| znorm | Inf | ||
| sky | -Inf | -NaN | -Inf |
| S/N | 28.0 | 46.0 | 49.5 |
| S/N(c) | 0.0 | 0.0 | 0.0 |
| SN(E/C) |
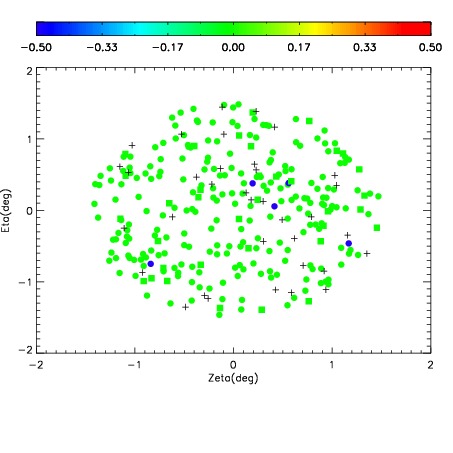
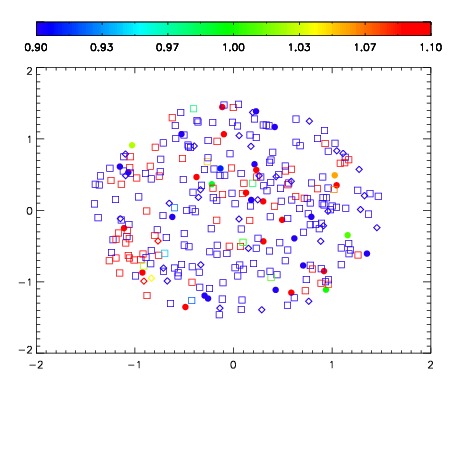


| Frame | Nreads | Zeropoints | Mag plots | Spatial mag deviation | Spatial sky 16325A emission deviations (filled: sky, open: star) | Spatial sky continuum emission | Spatial sky telluric CO2 absorption deviations (filled: H < 10) | |||||||||||||||||||||||
| 0 | 0 |
|
|
|
|
|
|
| IPAIR | NAME | SHIFT | NEWSHIFT | S/N | NAME | SHIFT | NEWSHIFT | S/N |
| 0 | 08160012 | 0.511721 | 0.00000 | 246.352 | 08160013 | -0.00408812 | 0.515809 | 245.501 |
| 1 | 08160011 | 0.500631 | 0.0110900 | 246.973 | 08160010 | 0.00000 | 0.511721 | 247.200 |
| 2 | 08160015 | 0.498030 | 0.0136910 | 237.024 | 08160014 | -0.00486349 | 0.516585 | 242.425 |
| 3 | 08160016 | 0.509946 | 0.00177503 | 233.232 | 08160017 | -0.00341282 | 0.515134 | 233.432 |