| Red | Green | Blue | |
| z | 17.64 | ||
| znorm | Inf | ||
| sky | -NaN | -NaN | -Inf |
| S/N | 20.8 | 37.0 | 39.2 |
| S/N(c) | 0.0 | 0.0 | 0.0 |
| SN(E/C) |
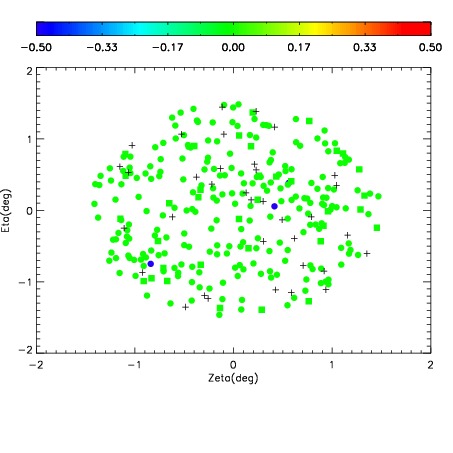
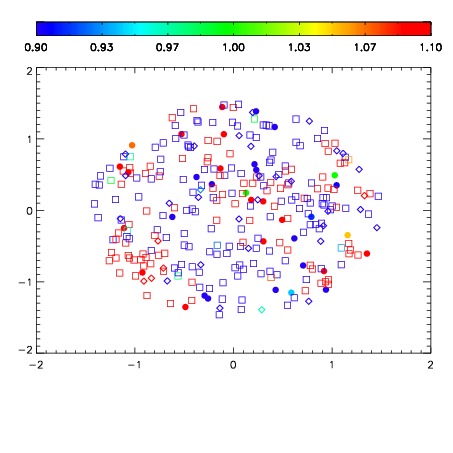
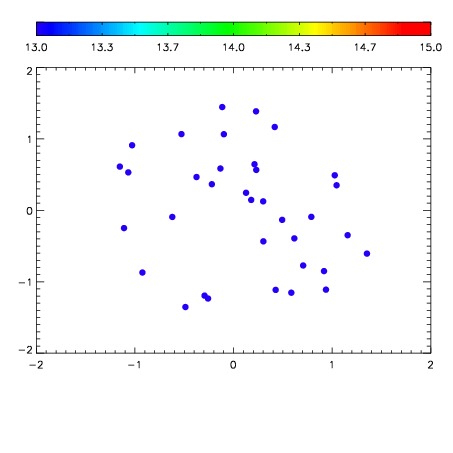

| Frame | Nreads | Zeropoints | Mag plots | Spatial mag deviation | Spatial sky 16325A emission deviations (filled: sky, open: star) | Spatial sky continuum emission | Spatial sky telluric CO2 absorption deviations (filled: H < 10) | |||||||||||||||||||||||
| 0 | 0 |
|
|
|
|
|
|
| IPAIR | NAME | SHIFT | NEWSHIFT | S/N | NAME | SHIFT | NEWSHIFT | S/N |
| 0 | 08400013 | 0.507653 | 0.00000 | 194.271 | 08400011 | 0.00000 | 0.507653 | 208.604 |
| 1 | 08400012 | 0.506817 | 0.000836015 | 212.396 | 08400018 | 0.00131096 | 0.506342 | 210.312 |
| 2 | 08400017 | 0.504974 | 0.00267899 | 189.582 | 08400014 | 0.00221973 | 0.505433 | 194.447 |
| 3 | 08400016 | 0.504822 | 0.00283098 | 183.313 | 08400015 | 0.000528324 | 0.507125 | 190.977 |