| Red | Green | Blue | |
| z | 17.64 | ||
| znorm | Inf | ||
| sky | -Inf | -Inf | -Inf |
| S/N | 25.1 | 44.2 | 46.4 |
| S/N(c) | 0.0 | 0.0 | 0.0 |
| SN(E/C) |
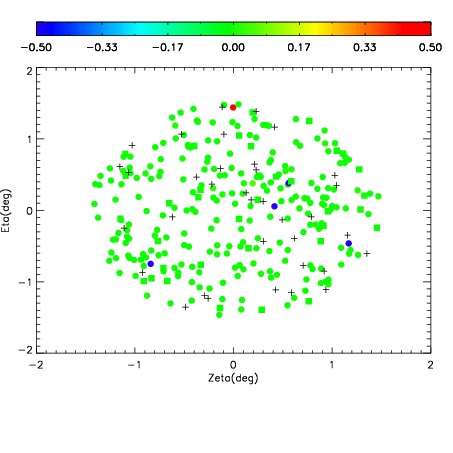
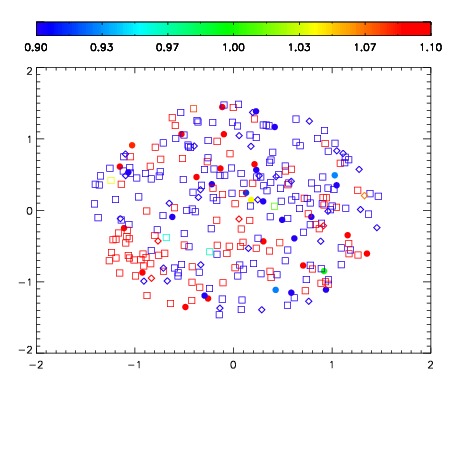
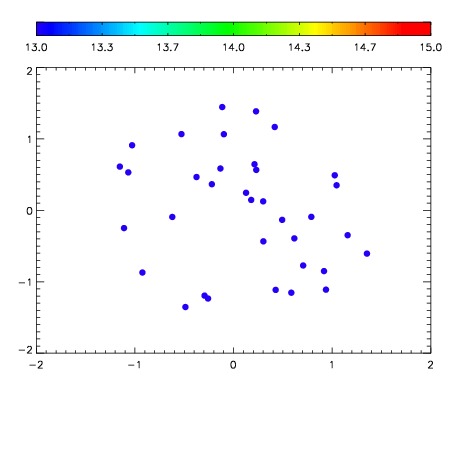

| Frame | Nreads | Zeropoints | Mag plots | Spatial mag deviation | Spatial sky 16325A emission deviations (filled: sky, open: star) | Spatial sky continuum emission | Spatial sky telluric CO2 absorption deviations (filled: H < 10) | |||||||||||||||||||||||
| 0 | 0 |
|
|
|
|
|
|
| IPAIR | NAME | SHIFT | NEWSHIFT | S/N | NAME | SHIFT | NEWSHIFT | S/N |
| 0 | 08450035 | 0.489871 | 0.00000 | 184.490 | 08450033 | 0.00297605 | 0.486895 | 187.725 |
| 1 | 08450034 | 0.488618 | 0.00125301 | 187.767 | 08450036 | 0.00588448 | 0.483987 | 191.362 |
| 2 | 08450031 | 0.489078 | 0.000793010 | 176.409 | 08450032 | 0.00381192 | 0.486059 | 179.340 |
| 3 | 08450030 | 0.488398 | 0.00147301 | 172.957 | 08450029 | 0.00000 | 0.489871 | 174.118 |