| Red | Green | Blue | |
| z | 17.64 | ||
| znorm | Inf | ||
| sky | -Inf | -Inf | -Inf |
| S/N | 26.7 | 46.2 | 47.9 |
| S/N(c) | 0.0 | 0.0 | 0.0 |
| SN(E/C) |
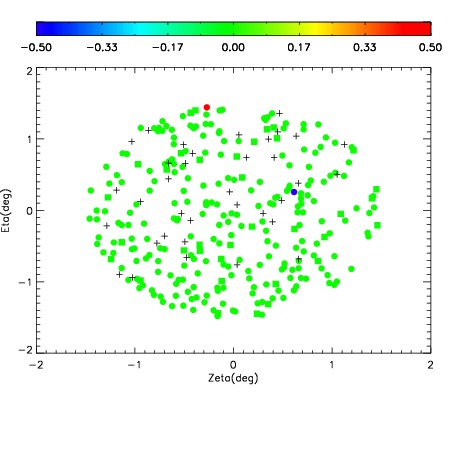

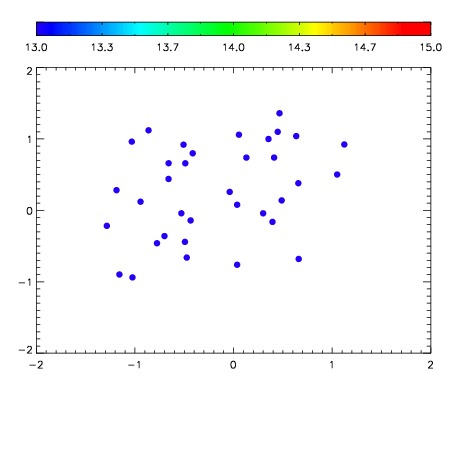

| Frame | Nreads | Zeropoints | Mag plots | Spatial mag deviation | Spatial sky 16325A emission deviations (filled: sky, open: star) | Spatial sky continuum emission | Spatial sky telluric CO2 absorption deviations (filled: H < 10) | |||||||||||||||||||||||
| 0 | 0 |
|
|
|
|
|
|
| IPAIR | NAME | SHIFT | NEWSHIFT | S/N | NAME | SHIFT | NEWSHIFT | S/N |
| 0 | 07920038 | 0.493432 | 0.00000 | 192.143 | 07920036 | -0.000617671 | 0.494050 | 190.871 |
| 1 | 07920039 | 0.493361 | 7.09891e-05 | 194.396 | 07920037 | -0.00191200 | 0.495344 | 191.737 |
| 2 | 07920035 | 0.493394 | 3.79980e-05 | 187.551 | 07920040 | -0.00155777 | 0.494990 | 188.827 |
| 3 | 07920034 | 0.491995 | 0.00143698 | 180.859 | 07920033 | 0.00000 | 0.493432 | 176.419 |