| Red | Green | Blue | |
| z | 17.64 | ||
| znorm | Inf | ||
| sky | -Inf | -Inf | -Inf |
| S/N | 25.6 | 44.7 | 49.1 |
| S/N(c) | 0.0 | 0.0 | 0.0 |
| SN(E/C) |

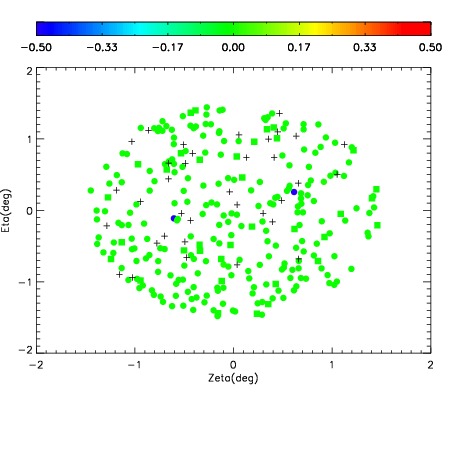


| Frame | Nreads | Zeropoints | Mag plots | Spatial mag deviation | Spatial sky 16325A emission deviations (filled: sky, open: star) | Spatial sky continuum emission | Spatial sky telluric CO2 absorption deviations (filled: H < 10) | |||||||||||||||||||||||
| 0 | 0 |
|
|
|
|
|
|
| IPAIR | NAME | SHIFT | NEWSHIFT | S/N | NAME | SHIFT | NEWSHIFT | S/N |
| 0 | 08150028 | 0.513839 | 0.00000 | 177.927 | 08150026 | 0.00000 | 0.513839 | 179.304 |
| 1 | 08150031 | 0.501191 | 0.0126480 | 179.439 | 08150030 | 7.39647e-05 | 0.513765 | 185.208 |
| 2 | 08150027 | 0.502021 | 0.0118180 | 178.584 | 08150033 | -0.00138443 | 0.515223 | 183.531 |
| 3 | 08150032 | 0.511746 | 0.00209302 | 176.040 | 08150029 | 4.99282e-05 | 0.513789 | 178.013 |