| Red | Green | Blue | |
| z | 17.64 | ||
| znorm | Inf | ||
| sky | -Inf | -Inf | -Inf |
| S/N | 24.9 | 43.6 | 49.2 |
| S/N(c) | 0.0 | 0.0 | 0.0 |
| SN(E/C) |
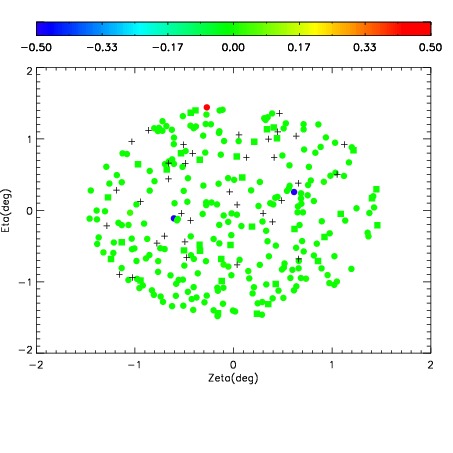
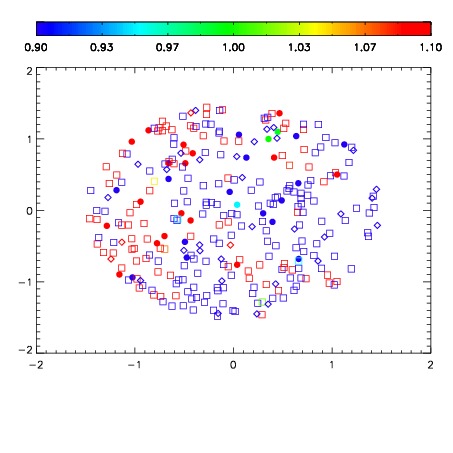
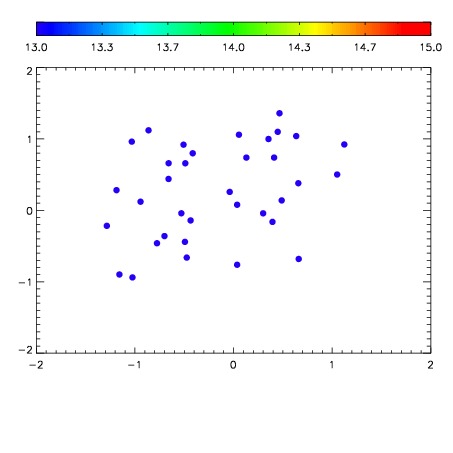

| Frame | Nreads | Zeropoints | Mag plots | Spatial mag deviation | Spatial sky 16325A emission deviations (filled: sky, open: star) | Spatial sky continuum emission | Spatial sky telluric CO2 absorption deviations (filled: H < 10) | |||||||||||||||||||||||
| 0 | 0 |
|
|
|
|
|
|
| IPAIR | NAME | SHIFT | NEWSHIFT | S/N | NAME | SHIFT | NEWSHIFT | S/N |
| 0 | 08410028 | 0.504331 | 0.00000 | 198.356 | 08410029 | 0.00353815 | 0.500793 | 200.868 |
| 1 | 08410032 | 0.503770 | 0.000560999 | 206.049 | 08410033 | 0.00462894 | 0.499702 | 202.811 |
| 2 | 08410031 | 0.502782 | 0.00154901 | 204.681 | 08410030 | 0.00249612 | 0.501835 | 201.114 |
| 3 | 08410027 | 0.503113 | 0.00121802 | 190.940 | 08410026 | 0.00000 | 0.504331 | 190.350 |