| Red | Green | Blue | |
| z | 17.64 | ||
| znorm | Inf | ||
| sky | -Inf | -Inf | -Inf |
| S/N | 25.0 | 44.0 | 47.0 |
| S/N(c) | 0.0 | 0.0 | 0.0 |
| SN(E/C) |
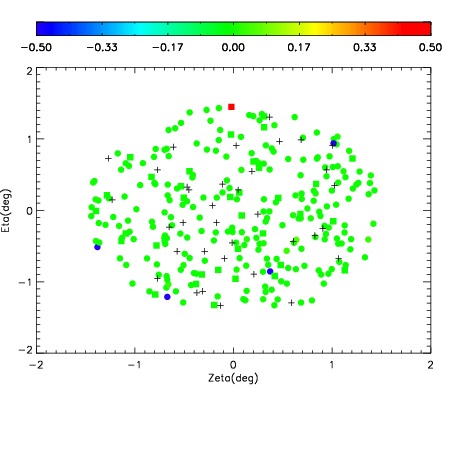
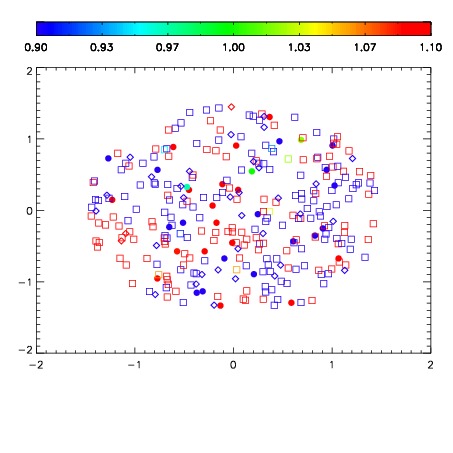
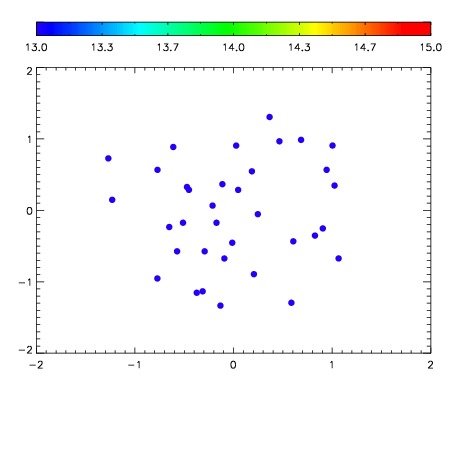

| Frame | Nreads | Zeropoints | Mag plots | Spatial mag deviation | Spatial sky 16325A emission deviations (filled: sky, open: star) | Spatial sky continuum emission | Spatial sky telluric CO2 absorption deviations (filled: H < 10) | |||||||||||||||||||||||
| 0 | 0 |
|
|
|
|
|
|
| IPAIR | NAME | SHIFT | NEWSHIFT | S/N | NAME | SHIFT | NEWSHIFT | S/N |
| 0 | 07910029 | 0.498684 | 0.00000 | 173.433 | 07910030 | -0.00182087 | 0.500505 | 171.687 |
| 1 | 07910028 | 0.496280 | 0.00240397 | 169.244 | 07910027 | -0.00348086 | 0.502165 | 168.434 |
| 2 | 07910025 | 0.498428 | 0.000256002 | 168.394 | 07910026 | -0.00224117 | 0.500925 | 165.352 |
| 3 | 07910024 | 0.497113 | 0.00157100 | 165.491 | 07910023 | 0.00000 | 0.498684 | 160.343 |