| Red | Green | Blue | |
| z | 17.64 | ||
| znorm | Inf | ||
| sky | -Inf | -NaN | -Inf |
| S/N | 24.7 | 43.2 | 46.7 |
| S/N(c) | 0.0 | 0.0 | 0.0 |
| SN(E/C) |
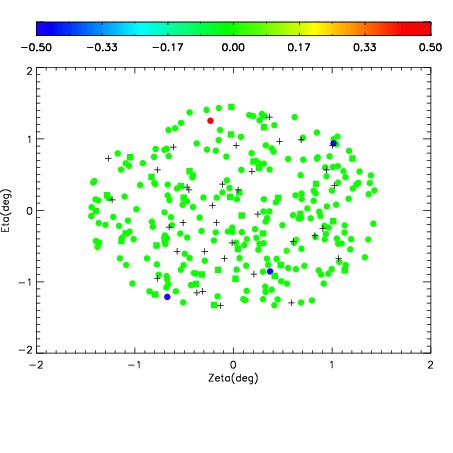
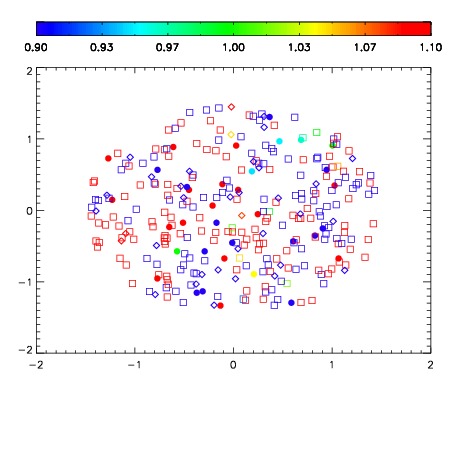


| Frame | Nreads | Zeropoints | Mag plots | Spatial mag deviation | Spatial sky 16325A emission deviations (filled: sky, open: star) | Spatial sky continuum emission | Spatial sky telluric CO2 absorption deviations (filled: H < 10) | |||||||||||||||||||||||
| 0 | 0 |
|
|
|
|
|
|
| IPAIR | NAME | SHIFT | NEWSHIFT | S/N | NAME | SHIFT | NEWSHIFT | S/N |
| 0 | 08400032 | 0.507412 | 0.00000 | 157.635 | 08400033 | 0.00788638 | 0.499526 | 159.407 |
| 1 | 08400027 | 0.505770 | 0.00164199 | 170.394 | 08400030 | 0.00818531 | 0.499227 | 172.415 |
| 2 | 08400031 | 0.506917 | 0.000495017 | 166.156 | 08400029 | 0.00860698 | 0.498805 | 164.582 |
| 3 | 08400028 | 0.506649 | 0.000762999 | 165.295 | 08400026 | 0.00000 | 0.507412 | 162.498 |