| Red | Green | Blue | |
| z | 17.64 | ||
| znorm | Inf | ||
| sky | -Inf | -Inf | -Inf |
| S/N | 27.0 | 47.1 | 52.3 |
| S/N(c) | 0.0 | 0.0 | 0.0 |
| SN(E/C) |
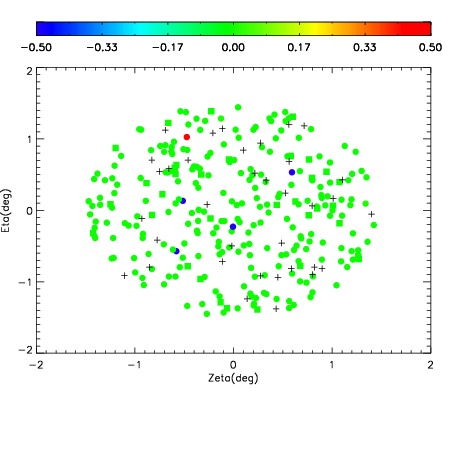
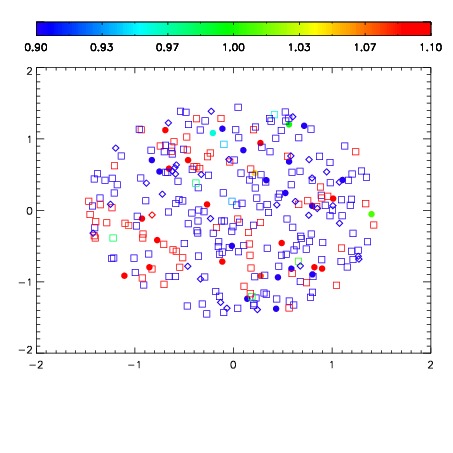
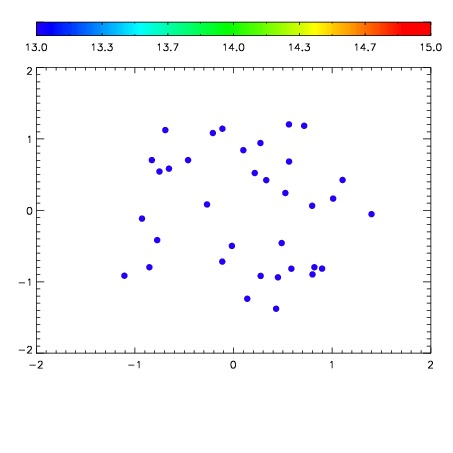

| Frame | Nreads | Zeropoints | Mag plots | Spatial mag deviation | Spatial sky 16325A emission deviations (filled: sky, open: star) | Spatial sky continuum emission | Spatial sky telluric CO2 absorption deviations (filled: H < 10) | |||||||||||||||||||||||
| 0 | 0 |
|
|
|
|
|
|
| IPAIR | NAME | SHIFT | NEWSHIFT | S/N | NAME | SHIFT | NEWSHIFT | S/N |
| 0 | 07870066 | 0.467274 | 0.00000 | 217.977 | 07870067 | -0.00272061 | 0.469995 | 223.082 |
| 1 | 07870069 | 0.466312 | 0.000962019 | 227.357 | 07870071 | 0.000203031 | 0.467071 | 229.952 |
| 2 | 07870070 | 0.466901 | 0.000373006 | 227.266 | 07870068 | -0.00266510 | 0.469939 | 227.004 |
| 3 | 07870065 | 0.465207 | 0.00206700 | 217.600 | 07870064 | 0.00000 | 0.467274 | 217.358 |