| Red | Green | Blue | |
| z | 17.64 | ||
| znorm | Inf | ||
| sky | -Inf | -Inf | -Inf |
| S/N | 28.1 | 47.0 | 51.8 |
| S/N(c) | 0.0 | 0.0 | 0.0 |
| SN(E/C) |
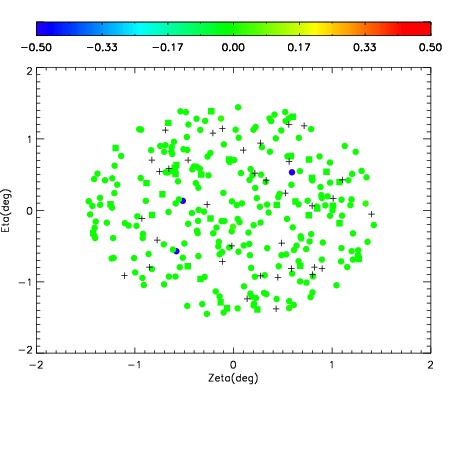
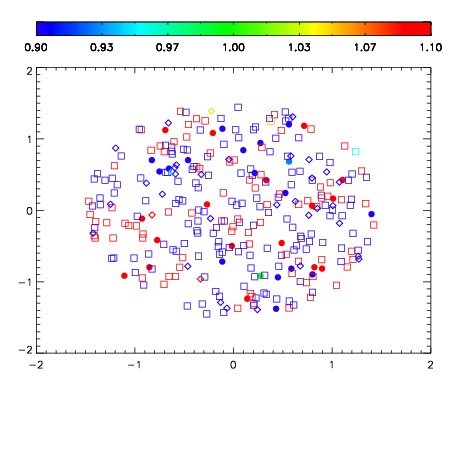


| Frame | Nreads | Zeropoints | Mag plots | Spatial mag deviation | Spatial sky 16325A emission deviations (filled: sky, open: star) | Spatial sky continuum emission | Spatial sky telluric CO2 absorption deviations (filled: H < 10) | |||||||||||||||||||||||
| 0 | 0 |
|
|
|
|
|
|
| IPAIR | NAME | SHIFT | NEWSHIFT | S/N | NAME | SHIFT | NEWSHIFT | S/N |
| 0 | 08400043 | 0.502733 | 0.00000 | 235.348 | 08400040 | 0.00258183 | 0.500151 | 233.810 |
| 1 | 08400042 | 0.501514 | 0.00121897 | 234.865 | 08400044 | 0.00110822 | 0.501625 | 233.599 |
| 2 | 08400039 | 0.502450 | 0.000283003 | 225.318 | 08400041 | 6.88254e-05 | 0.502664 | 226.529 |
| 3 | 08400038 | 0.502151 | 0.000581980 | 221.925 | 08400037 | 0.00000 | 0.502733 | 209.044 |