| Red | Green | Blue | |
| z | 17.64 | ||
| znorm | Inf | ||
| sky | -Inf | -Inf | -Inf |
| S/N | 21.5 | 37.4 | 40.3 |
| S/N(c) | 0.0 | 0.0 | 0.0 |
| SN(E/C) |

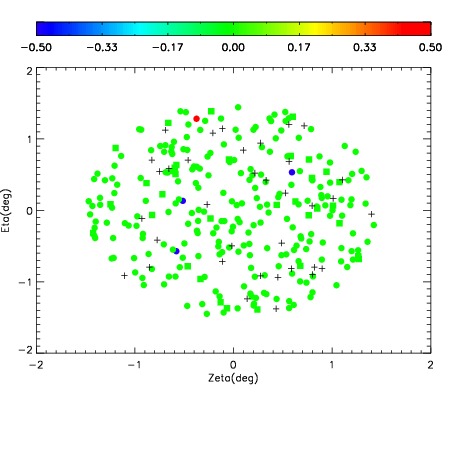
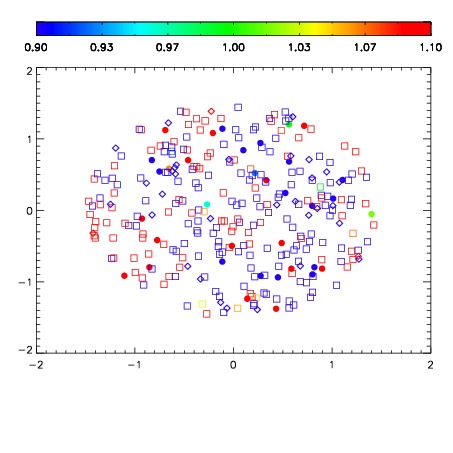
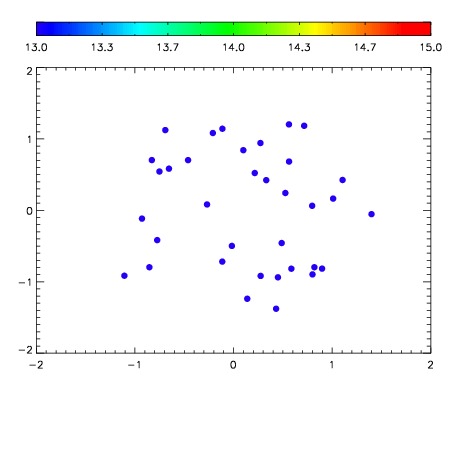

| Frame | Nreads | Zeropoints | Mag plots | Spatial mag deviation | Spatial sky 16325A emission deviations (filled: sky, open: star) | Spatial sky continuum emission | Spatial sky telluric CO2 absorption deviations (filled: H < 10) | |||||||||||||||||||||||
| 0 | 0 |
|
|
|
|
|
|
| IPAIR | NAME | SHIFT | NEWSHIFT | S/N | NAME | SHIFT | NEWSHIFT | S/N |
| 0 | 08440012 | 0.491609 | 0.00000 | 171.978 | 08440013 | 0.00544824 | 0.486161 | 172.092 |
| 1 | 08440011 | 0.490873 | 0.000735998 | 175.764 | 08440010 | 0.00000 | 0.491609 | 174.152 |
| 2 | 08440015 | 0.489193 | 0.00241601 | 174.601 | 08440014 | 0.00148496 | 0.490124 | 173.906 |
| 3 | 08440016 | 0.489925 | 0.00168401 | 174.282 | 08440017 | 0.00384360 | 0.487765 | 173.820 |