| Red | Green | Blue | |
| z | 17.64 | ||
| znorm | Inf | ||
| sky | -NaN | -NaN | -Inf |
| S/N | 15.0 | 23.7 | 28.8 |
| S/N(c) | 0.0 | 0.0 | 0.0 |
| SN(E/C) |
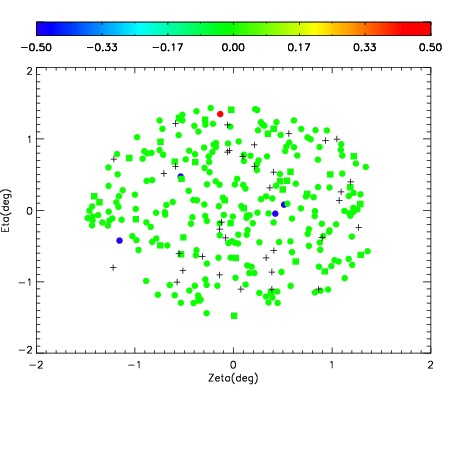
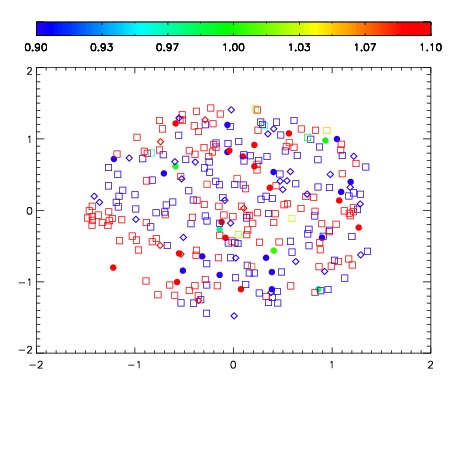
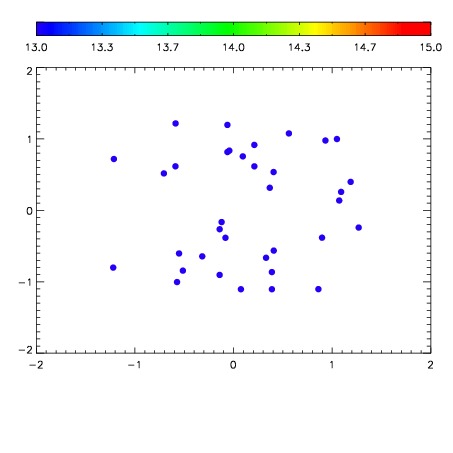

| Frame | Nreads | Zeropoints | Mag plots | Spatial mag deviation | Spatial sky 16325A emission deviations (filled: sky, open: star) | Spatial sky continuum emission | Spatial sky telluric CO2 absorption deviations (filled: H < 10) | |||||||||||||||||||||||
| 0 | 0 |
|
|
|
|
|
|
| IPAIR | NAME | SHIFT | NEWSHIFT | S/N | NAME | SHIFT | NEWSHIFT | S/N |
| 0 | 08170039 | 0.513646 | 0.00000 | 69.7243 | 08170040 | -0.000622733 | 0.514269 | 18.2880 |
| 1 | 08170035 | 0.512215 | 0.00143099 | 191.866 | 08170033 | 0.00000 | 0.513646 | 215.418 |
| 2 | 08170034 | 0.504236 | 0.00941002 | 190.769 | 08170036 | -0.00149447 | 0.515140 | 180.291 |
| 3 | 08170038 | 0.506208 | 0.00743800 | 105.350 | 08170037 | -0.00256022 | 0.516206 | 134.116 |