| Red | Green | Blue | |
| z | 17.64 | ||
| znorm | Inf | ||
| sky | -Inf | -NaN | -Inf |
| S/N | 24.9 | 41.3 | 46.4 |
| S/N(c) | 0.0 | 0.0 | 0.0 |
| SN(E/C) |
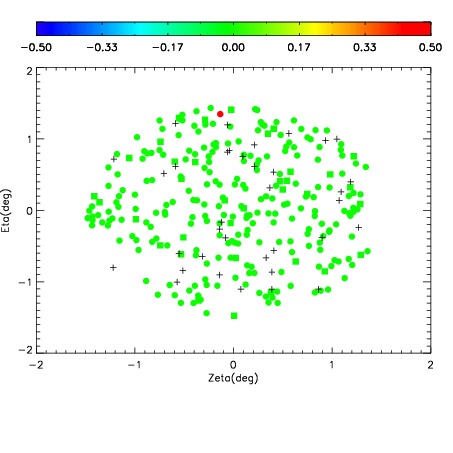
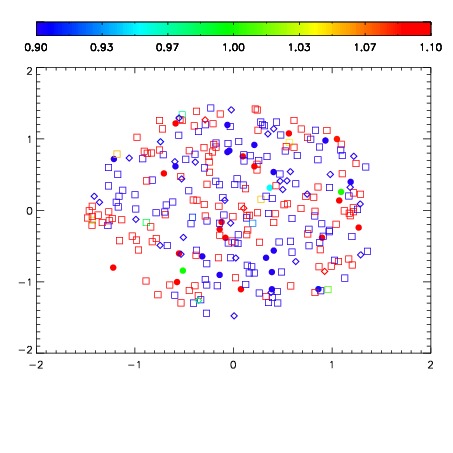
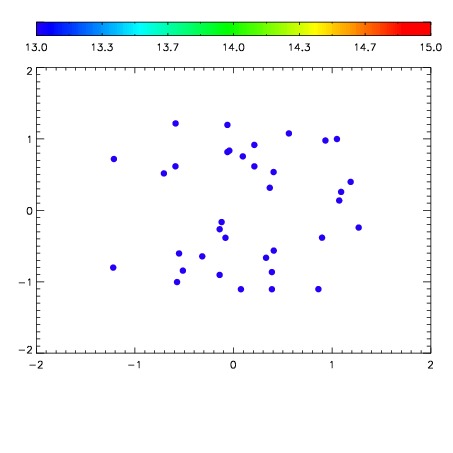

| Frame | Nreads | Zeropoints | Mag plots | Spatial mag deviation | Spatial sky 16325A emission deviations (filled: sky, open: star) | Spatial sky continuum emission | Spatial sky telluric CO2 absorption deviations (filled: H < 10) | |||||||||||||||||||||||
| 0 | 0 |
|
|
|
|
|
|
| IPAIR | NAME | SHIFT | NEWSHIFT | S/N | NAME | SHIFT | NEWSHIFT | S/N |
| 0 | 08440026 | 0.490023 | 0.00000 | 195.417 | 08440025 | 0.00000 | 0.490023 | 204.861 |
| 1 | 08440030 | 0.487512 | 0.00251099 | 225.690 | 08440032 | 0.00723807 | 0.482785 | 229.022 |
| 2 | 08440031 | 0.488904 | 0.00111899 | 225.554 | 08440029 | 0.00340554 | 0.486617 | 219.660 |
| 3 | 08440027 | 0.489592 | 0.000431001 | 216.489 | 08440028 | 0.00579790 | 0.484225 | 215.766 |