| Red | Green | Blue | |
| z | 17.63 | ||
| znorm | Inf | ||
| sky | -Inf | -Inf | -NaN |
| S/N | 22.9 | 38.7 | 43.7 |
| S/N(c) | 0.0 | 0.0 | 0.0 |
| SN(E/C) |

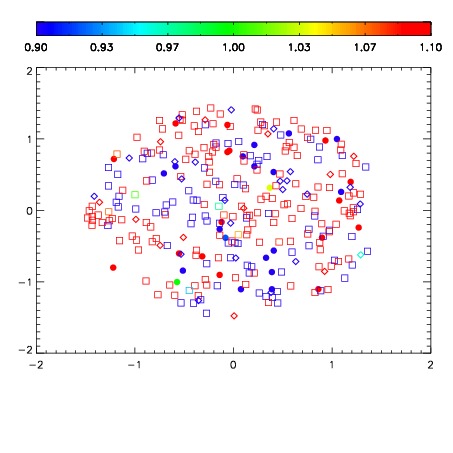
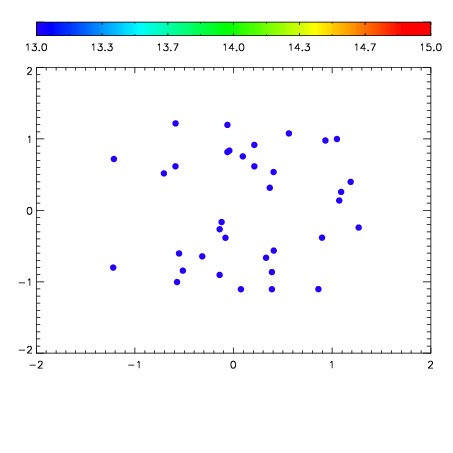

| Frame | Nreads | Zeropoints | Mag plots | Spatial mag deviation | Spatial sky 16325A emission deviations (filled: sky, open: star) | Spatial sky continuum emission | Spatial sky telluric CO2 absorption deviations (filled: H < 10) | |||||||||||||||||||||||
| 0 | 0 |
|
|
|
|
|
|
| IPAIR | NAME | SHIFT | NEWSHIFT | S/N | NAME | SHIFT | NEWSHIFT | S/N |
| 0 | 08480032 | 0.490987 | 0.00000 | 189.164 | 08480029 | 0.00295082 | 0.488036 | 193.938 |
| 1 | 08480027 | 0.490538 | 0.000449002 | 193.738 | 08480033 | 0.00208002 | 0.488907 | 198.117 |
| 2 | 08480031 | 0.489751 | 0.00123599 | 193.493 | 08480026 | 0.00000 | 0.490987 | 197.742 |
| 3 | 08480028 | 0.490908 | 7.90060e-05 | 192.666 | 08480030 | 0.00181173 | 0.489175 | 196.174 |