| Red | Green | Blue | |
| z | 17.64 | ||
| znorm | Inf | ||
| sky | -NaN | -Inf | -Inf |
| S/N | 21.1 | 36.4 | 42.6 |
| S/N(c) | 0.0 | 0.0 | 0.0 |
| SN(E/C) |
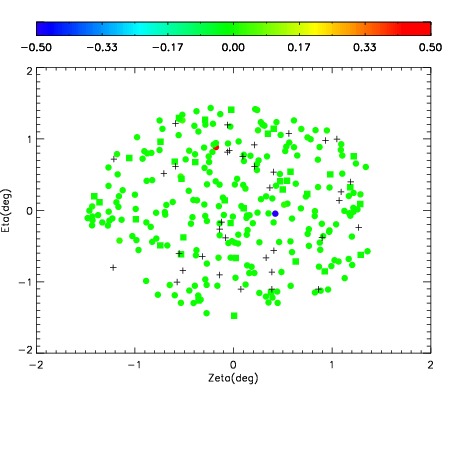
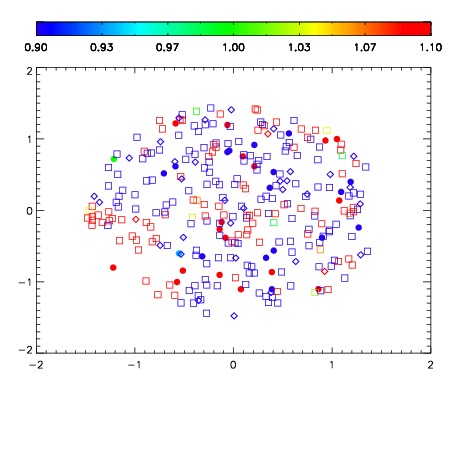
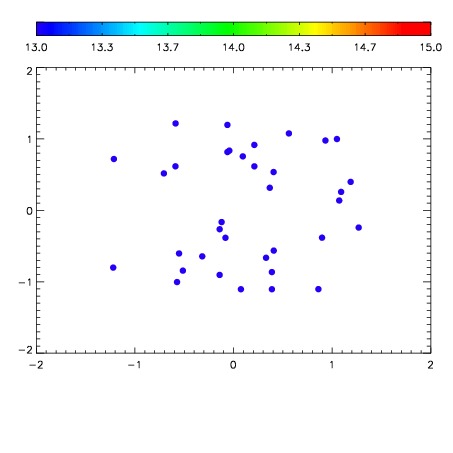

| Frame | Nreads | Zeropoints | Mag plots | Spatial mag deviation | Spatial sky 16325A emission deviations (filled: sky, open: star) | Spatial sky continuum emission | Spatial sky telluric CO2 absorption deviations (filled: H < 10) | |||||||||||||||||||||||
| 0 | 0 |
|
|
|
|
|
|
| IPAIR | NAME | SHIFT | NEWSHIFT | S/N | NAME | SHIFT | NEWSHIFT | S/N |
| 0 | 11180034 | 0.478359 | 0.00000 | 129.158 | 11180033 | 0.00000 | 0.478359 | 156.243 |
| 1 | 11180038 | 0.477088 | 0.00127101 | 236.807 | 11180037 | -0.00352865 | 0.481888 | 238.924 |
| 2 | 11180039 | 0.477451 | 0.000908017 | 226.946 | 11180036 | -0.00320783 | 0.481567 | 225.443 |
| 3 | 11180035 | 0.478092 | 0.000266999 | 167.087 | 11180040 | -0.00315558 | 0.481515 | 189.088 |