| Red | Green | Blue | |
| z | 17.64 | ||
| znorm | Inf | ||
| sky | -Inf | -Inf | -Inf |
| S/N | 21.9 | 38.1 | 42.5 |
| S/N(c) | 0.0 | 0.0 | 0.0 |
| SN(E/C) |

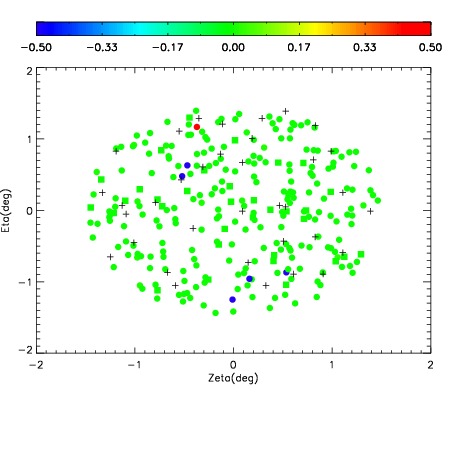
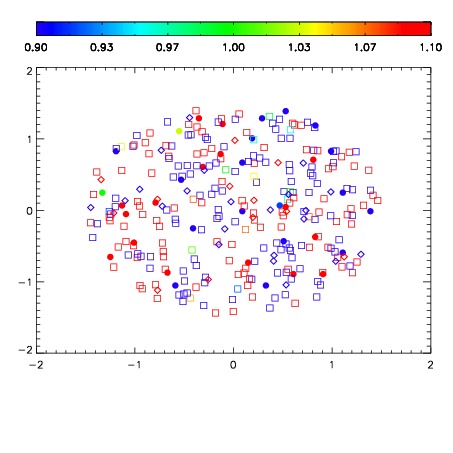
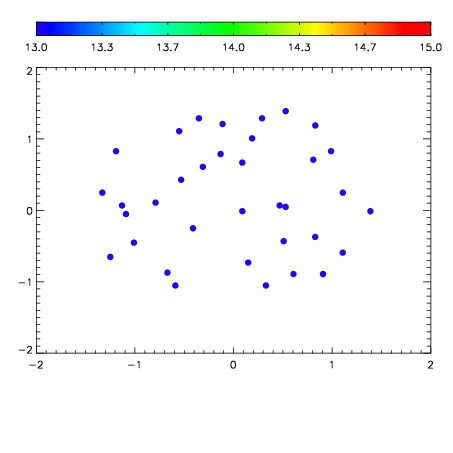

| Frame | Nreads | Zeropoints | Mag plots | Spatial mag deviation | Spatial sky 16325A emission deviations (filled: sky, open: star) | Spatial sky continuum emission | Spatial sky telluric CO2 absorption deviations (filled: H < 10) | |||||||||||||||||||||||
| 0 | 0 |
|
|
|
|
|
|
| IPAIR | NAME | SHIFT | NEWSHIFT | S/N | NAME | SHIFT | NEWSHIFT | S/N |
| 0 | 11380087 | 0.471884 | 0.00000 | 190.005 | 11380081 | 0.00000 | 0.471884 | 187.041 |
| 1 | 11380083 | 0.471372 | 0.000512004 | 206.347 | 11380084 | -0.00153228 | 0.473416 | 207.398 |
| 2 | 11380082 | 0.470705 | 0.00117901 | 196.329 | 11380085 | -0.00144965 | 0.473334 | 202.047 |
| 3 | 11380086 | 0.470328 | 0.00155601 | 191.410 | 11380088 | -0.00256185 | 0.474446 | 190.371 |