| Red | Green | Blue | |
| z | 17.64 | ||
| znorm | Inf | ||
| sky | -Inf | -Inf | -Inf |
| S/N | 16.4 | 29.9 | 34.2 |
| S/N(c) | 0.0 | 0.0 | 0.0 |
| SN(E/C) |
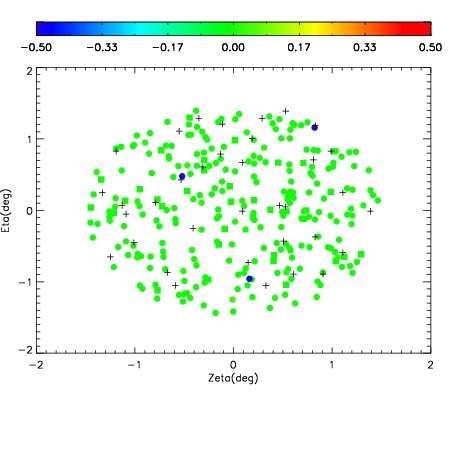
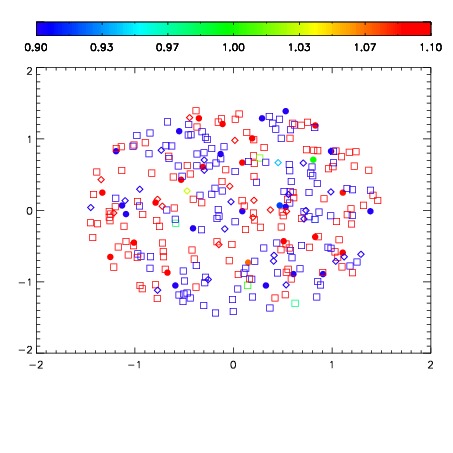
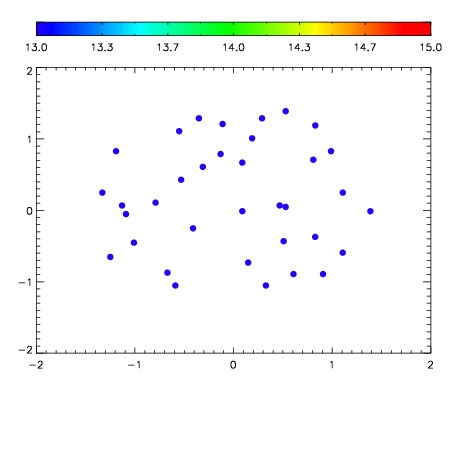

| Frame | Nreads | Zeropoints | Mag plots | Spatial mag deviation | Spatial sky 16325A emission deviations (filled: sky, open: star) | Spatial sky continuum emission | Spatial sky telluric CO2 absorption deviations (filled: H < 10) | |||||||||||||||||||||||
| 0 | 0 |
|
|
|
|
|
|
| IPAIR | NAME | SHIFT | NEWSHIFT | S/N | NAME | SHIFT | NEWSHIFT | S/N |
| 0 | 11430056 | 0.483730 | 0.00000 | 170.183 | 11430054 | -0.000212622 | 0.483943 | 167.178 |
| 1 | 11430052 | 0.482561 | 0.00116900 | 167.486 | 11430050 | 0.00000 | 0.483730 | 159.357 |
| 2 | 11430051 | 0.482472 | 0.00125799 | 159.503 | 11430053 | -0.000173924 | 0.483904 | 157.412 |
| 3 | 11430055 | 0.483535 | 0.000194997 | 159.207 | 11430057 | 4.27752e-05 | 0.483687 | 154.940 |