| Red | Green | Blue | |
| z | 17.64 | ||
| znorm | Inf | ||
| sky | -Inf | -Inf | -Inf |
| S/N | 24.4 | 42.9 | 48.4 |
| S/N(c) | 0.0 | 0.0 | 0.0 |
| SN(E/C) |
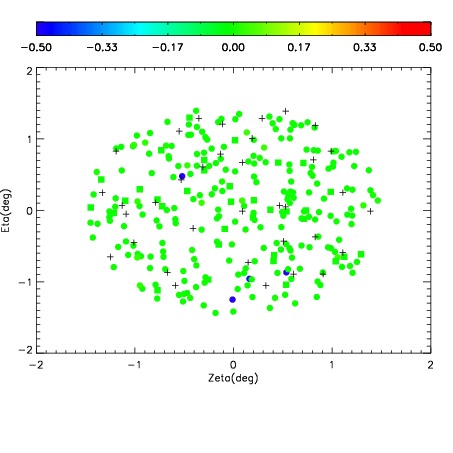
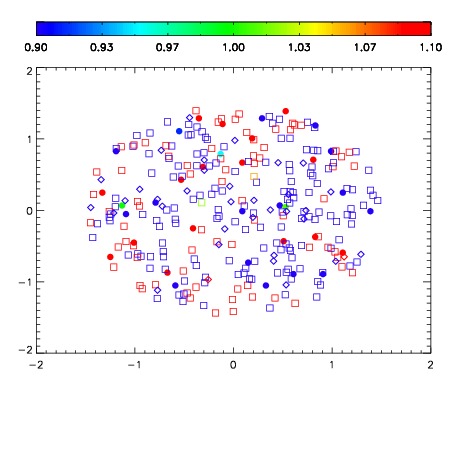


| Frame | Nreads | Zeropoints | Mag plots | Spatial mag deviation | Spatial sky 16325A emission deviations (filled: sky, open: star) | Spatial sky continuum emission | Spatial sky telluric CO2 absorption deviations (filled: H < 10) | |||||||||||||||||||||||
| 0 | 0 |
|
|
|
|
|
|
| IPAIR | NAME | SHIFT | NEWSHIFT | S/N | NAME | SHIFT | NEWSHIFT | S/N |
| 0 | 11470035 | 0.479603 | 0.00000 | 214.397 | 11470037 | -0.00125955 | 0.480863 | 210.463 |
| 1 | 11470034 | 0.478174 | 0.00142899 | 218.947 | 11470036 | -0.00175720 | 0.481360 | 215.174 |
| 2 | 11470039 | 0.479534 | 6.89924e-05 | 217.559 | 11470033 | 0.00000 | 0.479603 | 214.429 |
| 3 | 11470038 | 0.478903 | 0.000699997 | 213.907 | 11470040 | -0.000904842 | 0.480508 | 207.561 |